Cambridge sales share of new homes and older homes
July 2020 - June 2021
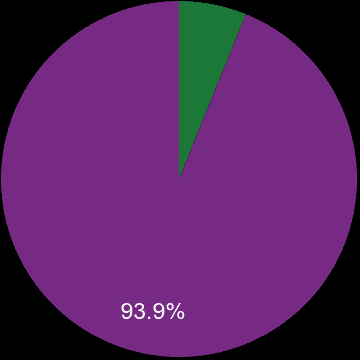
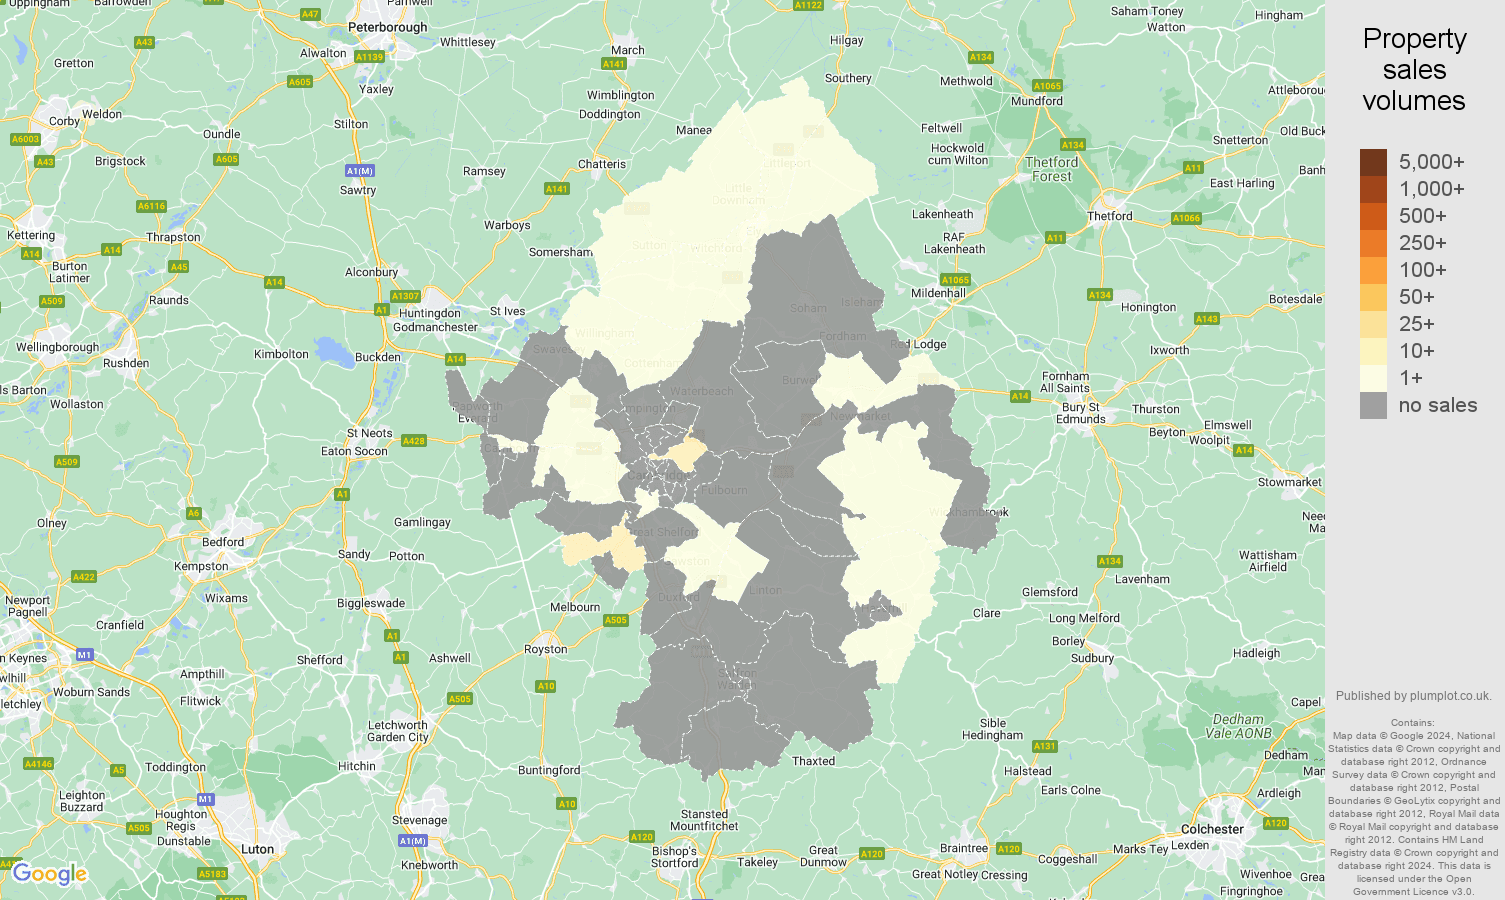
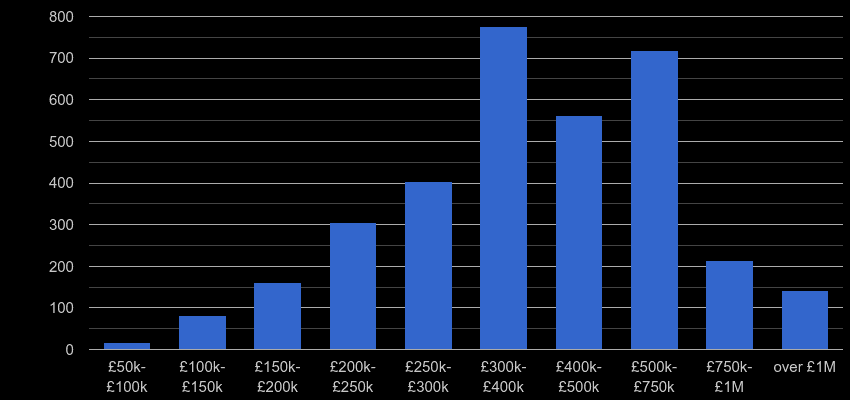
There were 5.0k property sales in Cambridge postcode area in the previous twelve months and sales dropped by 9.7% (-572 transactions). 264 properties, 5.3% were sales of a newly built property. Most properties were sold in the £300k-£400k price range with 1212 (24.5%) properties sold, followed by £400k-£500k price range with 877 (17.7%) properties sold.
| Property price range | Market share | Sales volume |
|---|---|---|
| under £50k | 0.0% | 1 |
| £50k-£100k | 0.4% | 22 |
| £100k-£150k | 2.2% | 108 |
| £150k-£200k | 6.7% | 330 |
| £200k-£250k | 11.5% | 569 |
| £250k-£300k | 12.6% | 626 |
| £300k-£400k | 24.5% | 1.2k |
| £400k-£500k | 17.7% | 877 |
| £500k-£750k | 17.0% | 842 |
| £750k-£1M | 4.8% | 236 |
| over £1M | 2.6% | 131 |
Number of sold properties by floor area size.
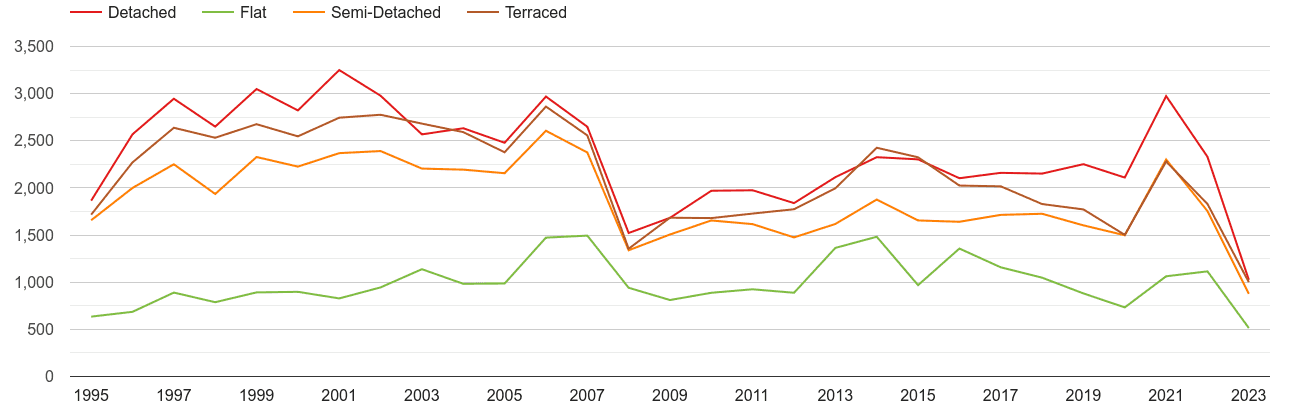
Yearly property sales volume by nominal price ranges
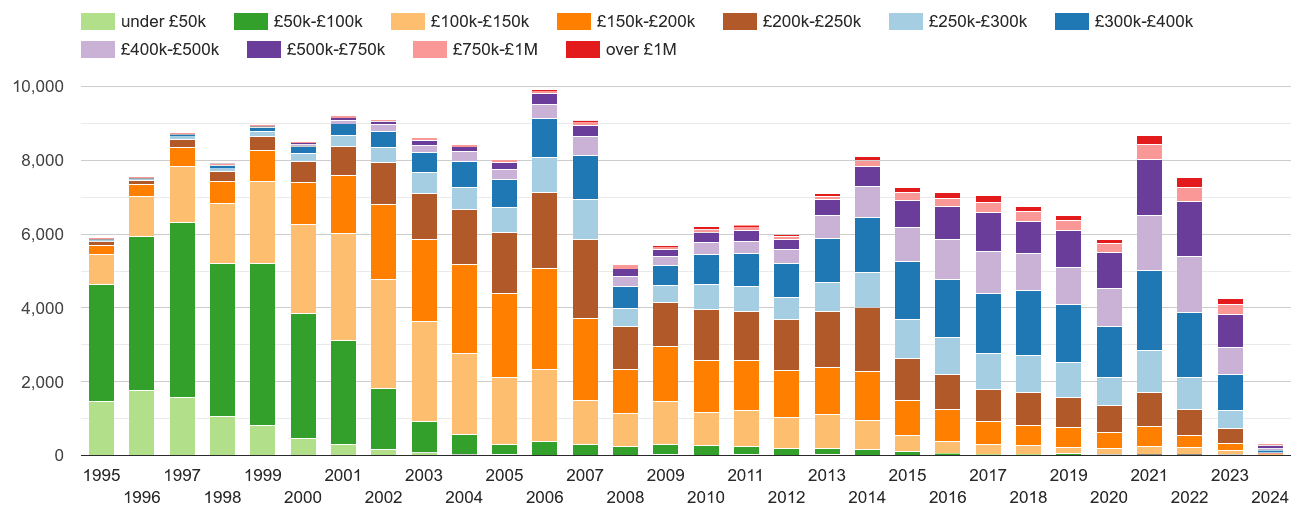
Total sales volume by year
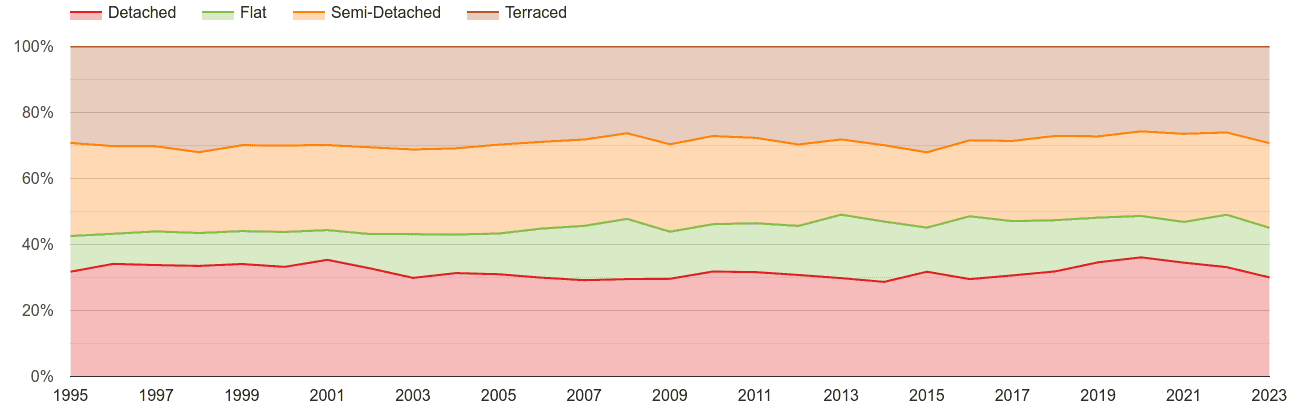
Market share by year
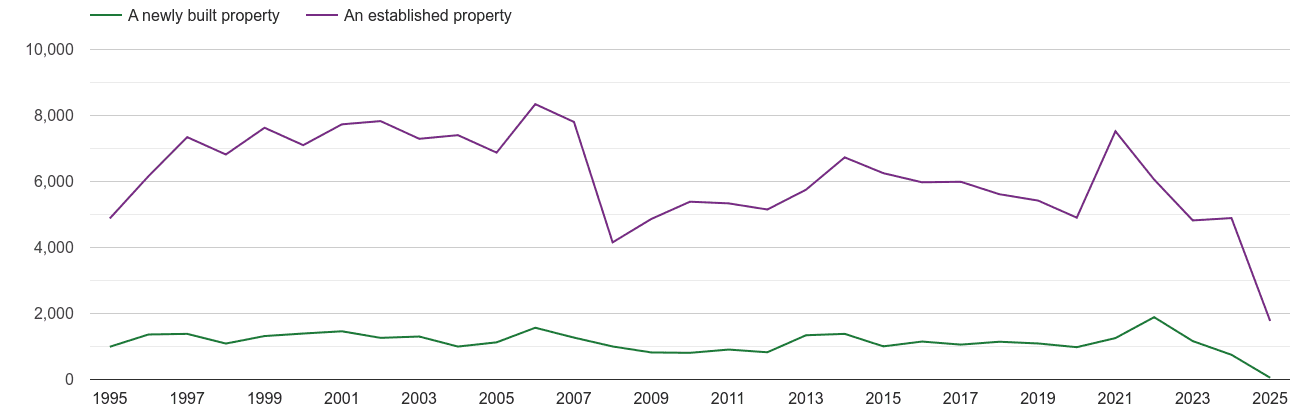
Total sales volumes by year
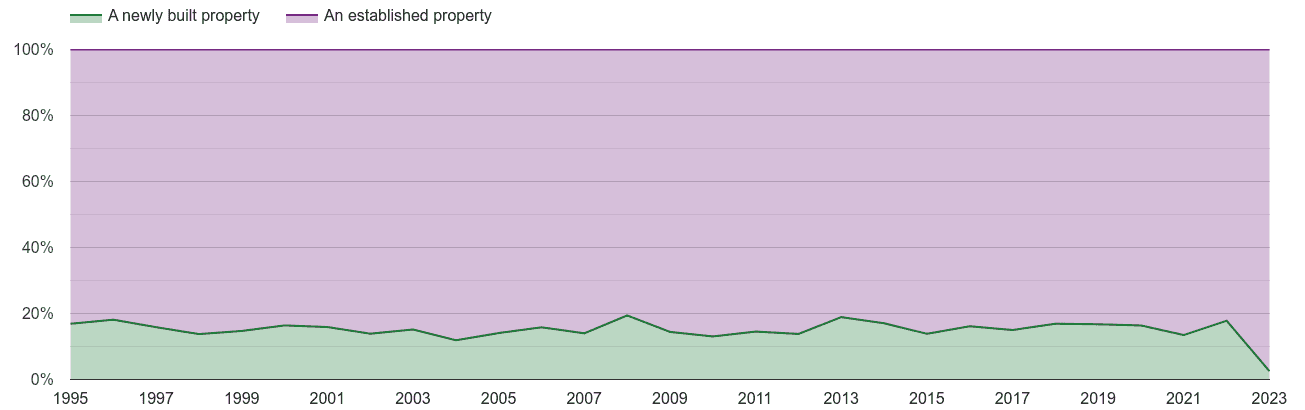
Market share by year
Compares annual percentage change in property transactions to other postcode areas. Metric compares a number of transactions between June 2020 - May 2021 to the number of transactions in the previous 12 months.
![]()
Comparison to other postcode areas. Metrics show a percentage change in property transactions (y-axis) and change in the average price (x-axis) between June 2020 - May 2021 and previous 12 months. The size of a circle is directly proportional to a number of property transactions in a postcode area.
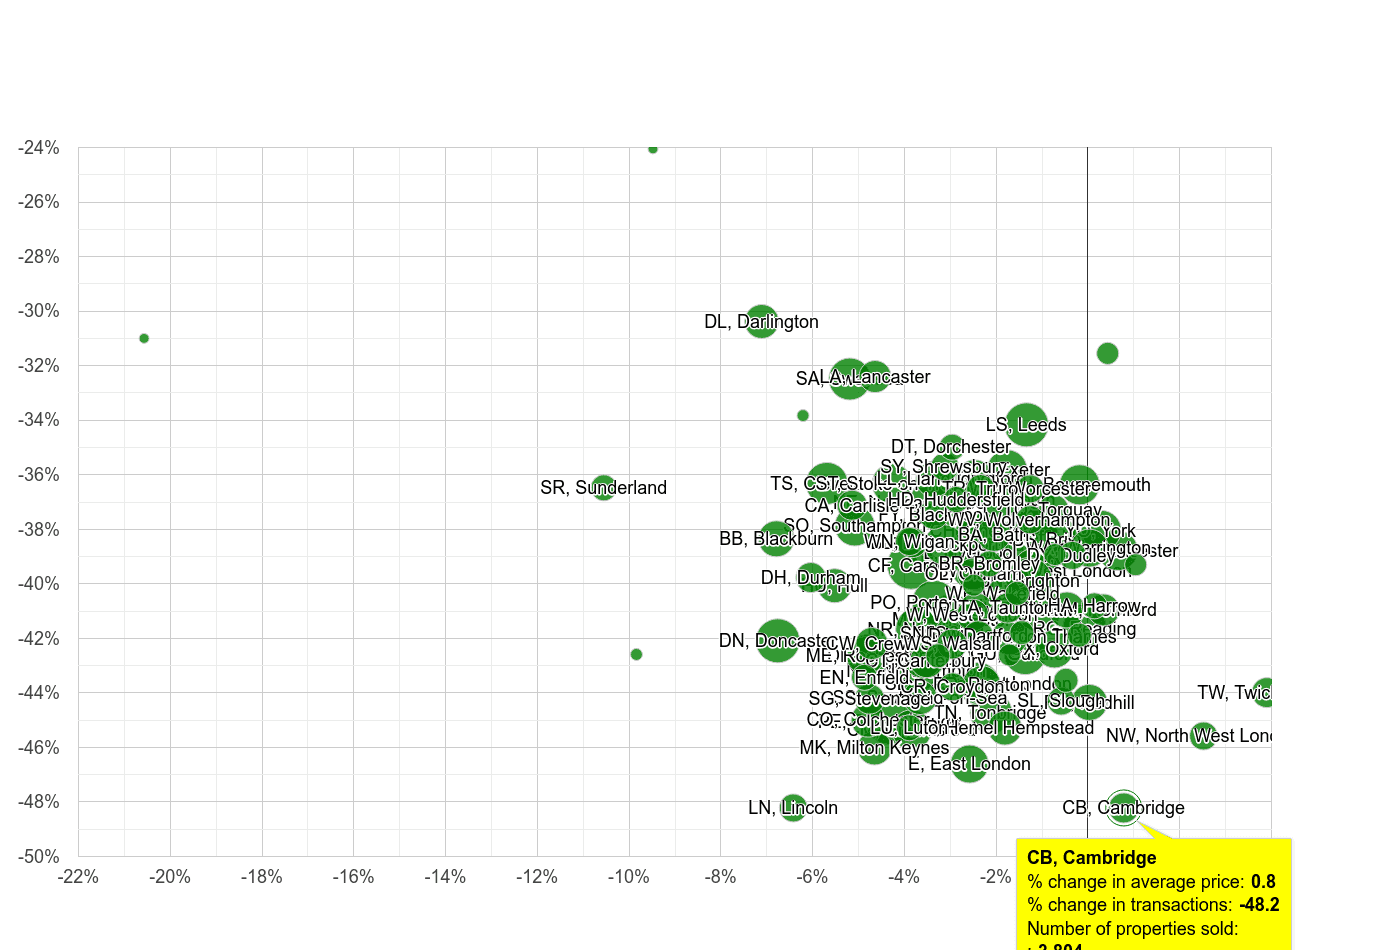 Percentage change in transactions
shows the total volume of new properties sold a given postcode sector.