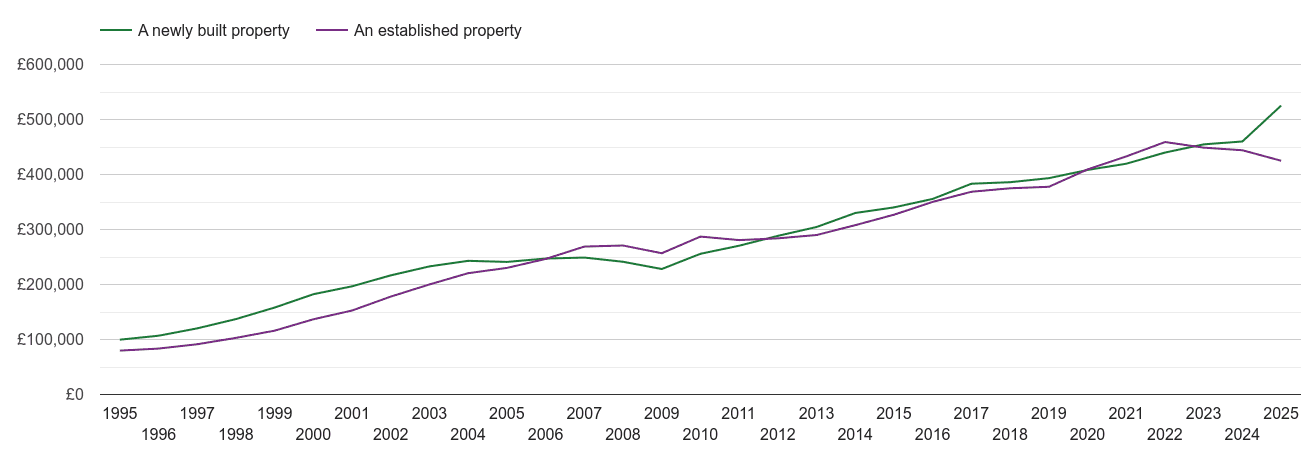
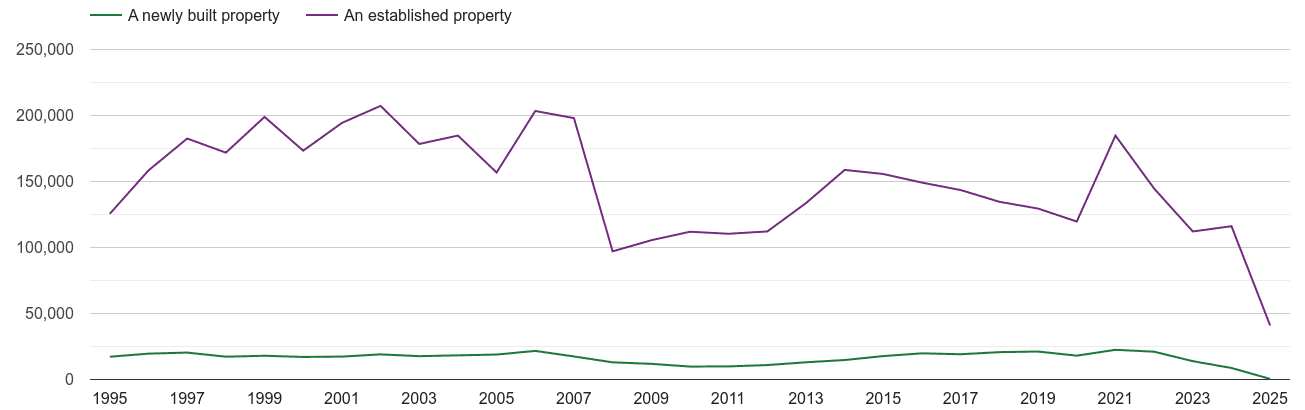
The price of a newly built property is £477k in South East region. The price increased by £23.0k (5%) over the last twelve months. The price of an established property is £451k. There were 1408 sales of newly build properties. Most new properties were sold in the £500k-£750k price range with 441 (31.3%) properties sold, followed by £400k-£500k price range with 326 (23.2%) properties sold. Most new homes were sold in Kent, with 317 sold to date from April 2023 - March 2024.
| April 2023 - March 2024 | South East region | England & Wales |
|---|---|---|
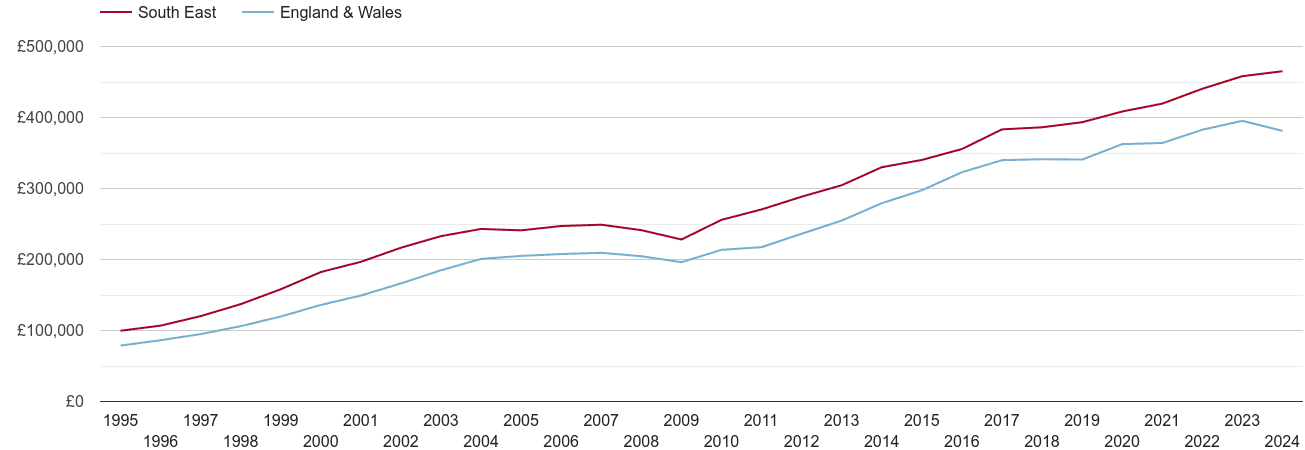
| Average price of a new home | £477k | £403k |
Average price change | 5% £23.0k | 5% £19.8k |
April 2023 - March 2024
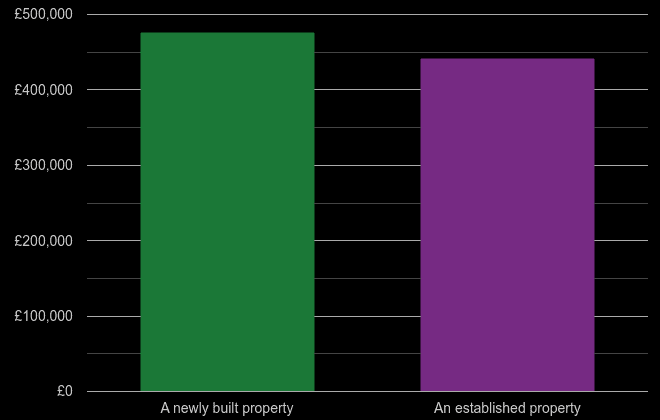
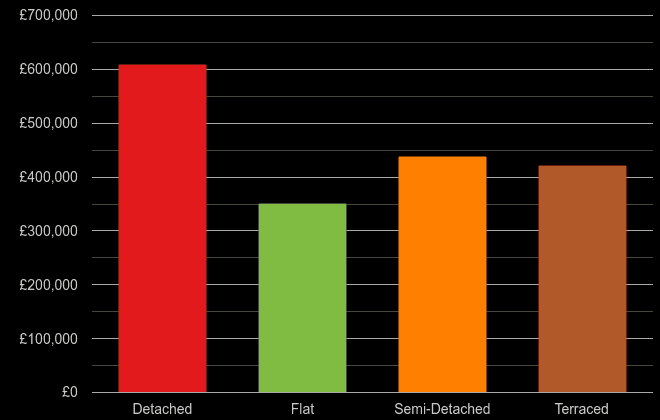
| New or established | Average price |
|---|---|
| █ A newly built property | £477k |
| █ An established property | £451k |
April 2023 - March 2024
shows the total volume of new homes sold a given county.
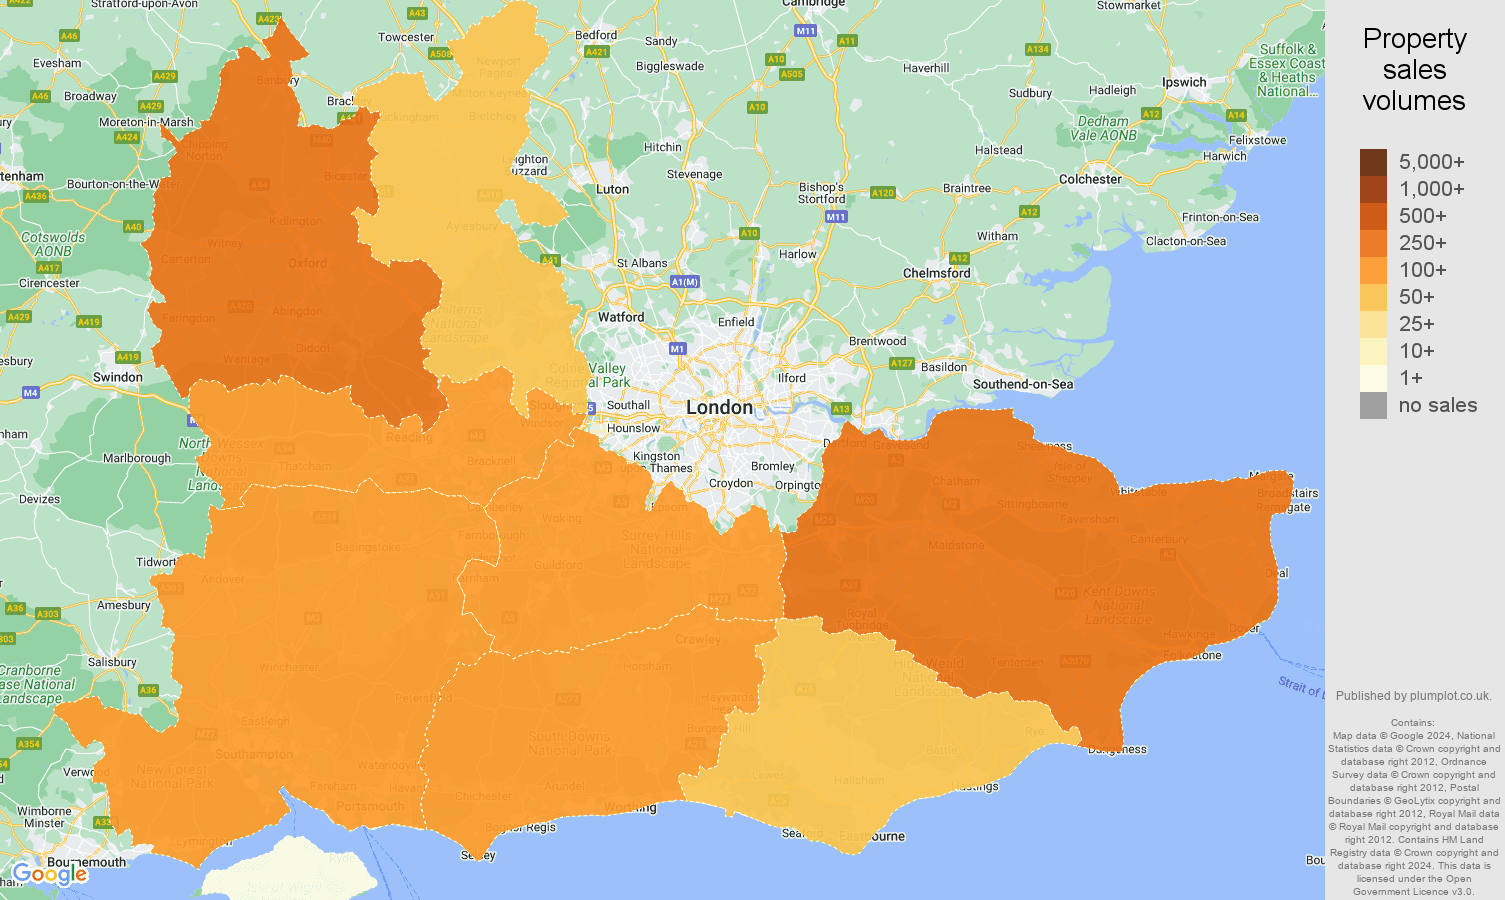
| County | Sales volume | Market share | |
|---|---|---|---|
| Berkshire | 186 | 13.2% | |
| Buckinghamshire | 86 | 6.1% | |
| East Sussex | 80 | 5.7% | |
| Hampshire | 141 | 10% | |
| Isle of Wight | 5 | 0.4% | |
| Kent | 317 | 22.5% | |
| Oxfordshire | 311 | 22.1% | |
| Surrey | 143 | 10.2% | |
| West Sussex | 139 | 9.9% | |
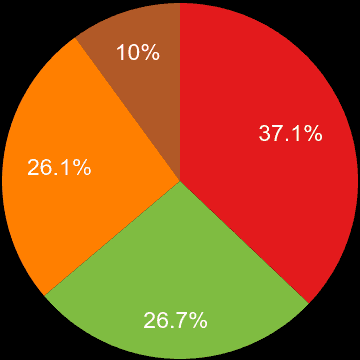
shows a sales volume of new homes in a given price range between April 2023 - March 2024. See also South East property sales reports.
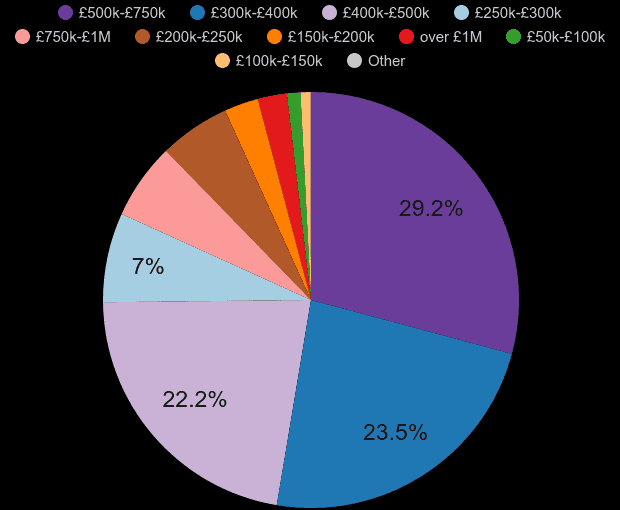
| Property price range | Market share | Sales volume |
|---|---|---|
| █ £100k-£150k | 0.4% | 6 |
| █ £150k-£200k | 2.8% | 40 |
| █ £200k-£250k | 4.6% | 65 |
| █ £250k-£300k | 9.6% | 135 |
| █ £300k-£400k | 21.0% | 295 |
| █ £400k-£500k | 23.2% | 326 |
| █ £500k-£750k | 31.3% | 441 |
| █ £750k-£1M | 5.3% | 75 |
| █ over £1M | 1.8% | 25 |
April 2023 - March 2024
April 2023 - March 2024
Yearly average nominal house prices adjusted for inflation

Yearly average nominal prices
Yearly average nominal prices
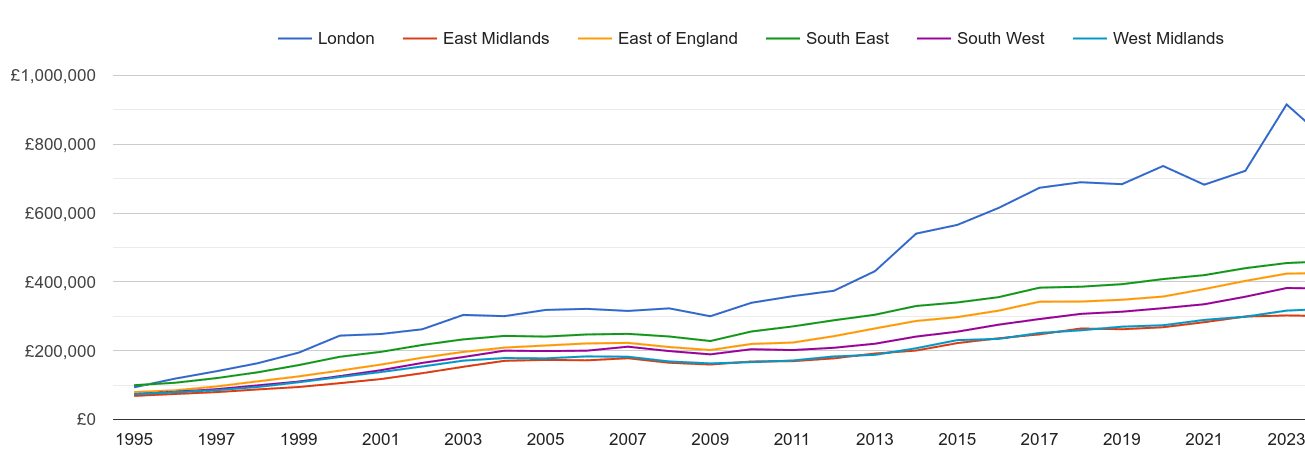
Yearly average nominal prices
Total sales volumes by year

 login →