The average property price in Bristol city is £382k, the median price is £340k. The average price increased by £12.7k (3%) over the last twelve months. The price of an established property is £382k. The price of a newly built property is £347k. There were 6.0k property sales and sales dropped by 19.1% (-1.5k transactions). Most properties were sold in the £300k-£400k price range with 1782 (29.9%) properties sold, followed by £250k-£300k price range with 1026 (17.2%) properties sold.
February 2024 - January 2025
Bristol city
England & Wales
Average price
█ £382k
█ £348k
Median price
█ £340k
█ £275k
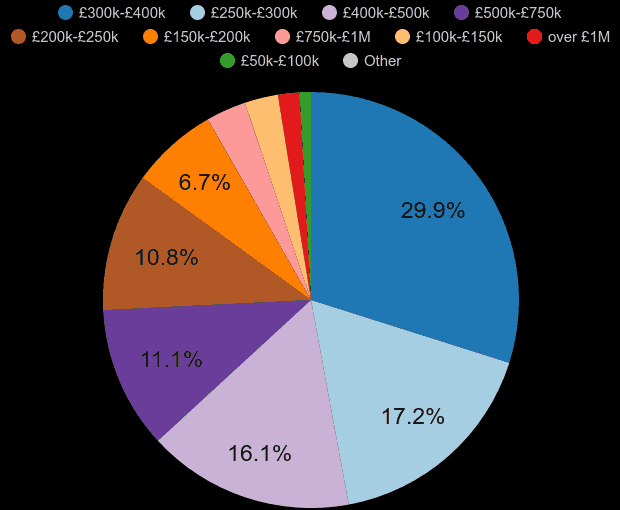
Bristol property sales share by price range
shows a number of properties sold in a given price range between February 2024 - January 2025.
Property price range
Market share
Sales volume
█ under £50k
0.0%
1
█ £50k-£100k
0.9%
52
█ £100k-£150k
2.6%
155
█ £150k-£200k
6.7%
402
█ £200k-£250k
10.8%
642
█ £250k-£300k
17.2%
1.0k
█ £300k-£400k
29.9%
1.8k
█ £400k-£500k
16.1%
958
█ £500k-£750k
11.1%
659
█ £750k-£1M
3.1%
186
█ over £1M
1.7%
99
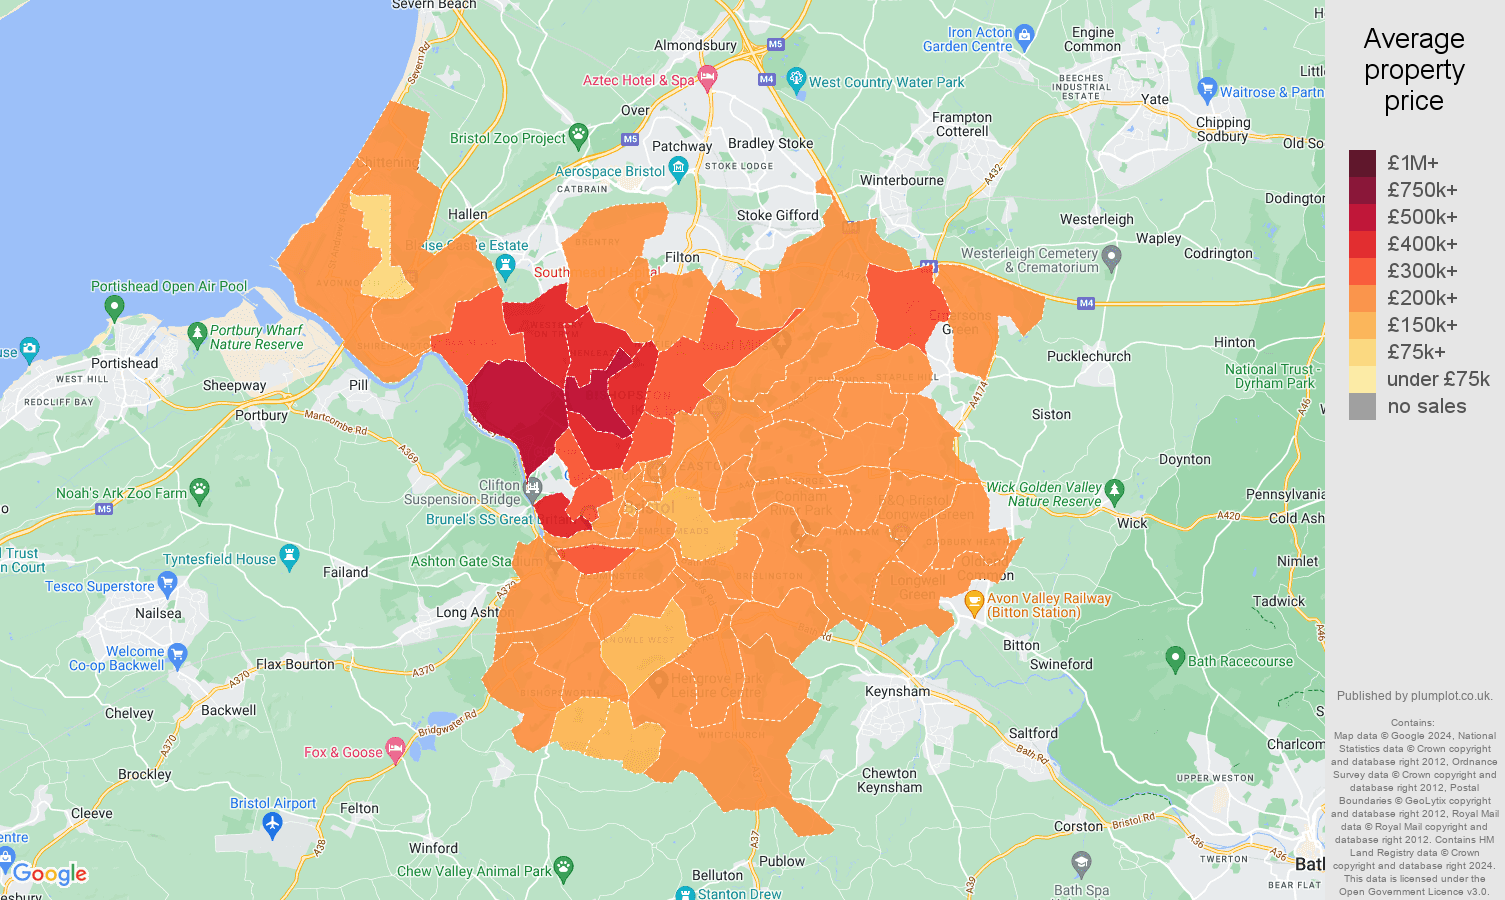
Bristol house prices map
This price map shows the average property price in a given postcode sector. The most affordable place is 'BS1 1' with the average price of £211k. The most expensive place is 'BS9 1', £748k.
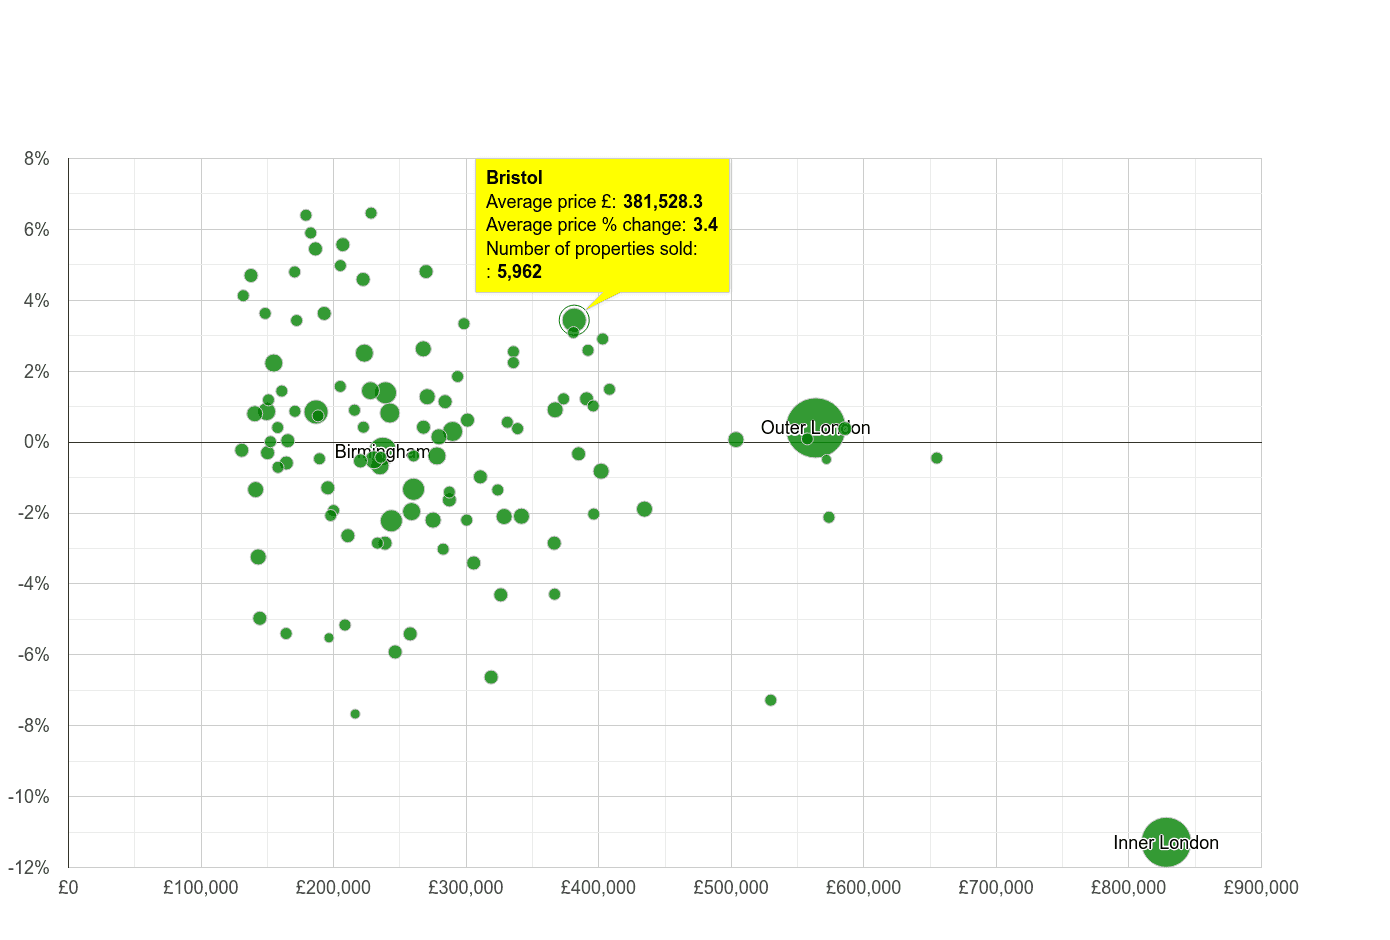
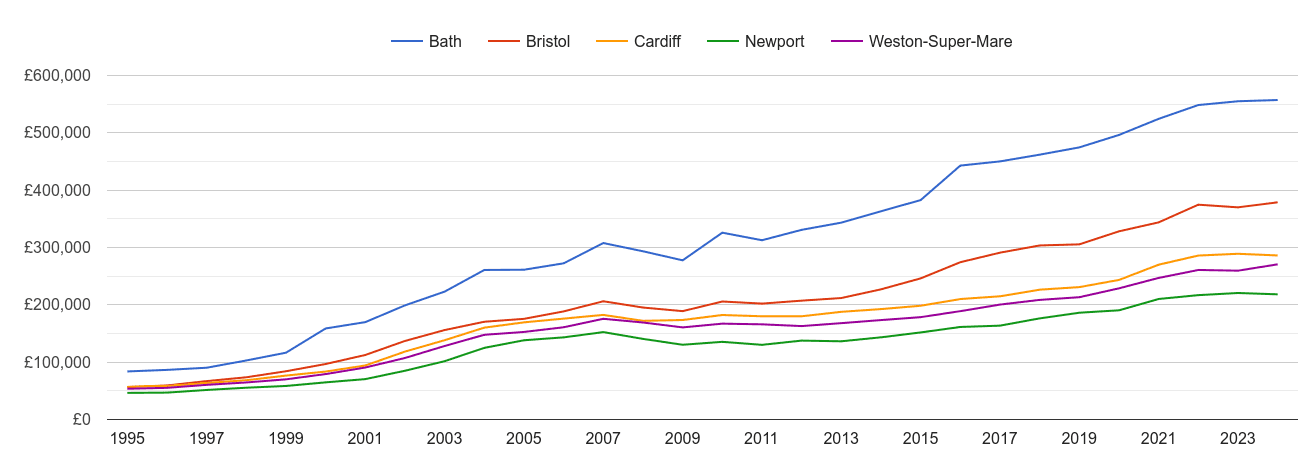
Bristol house prices compared to other cities
Comparison of the average property price and an average price percentage change by city. Price % change compares the average property price between February 2024 - January 2025 to the average price in the previous 12 months. The size of the circle shows the number of property transactions. The bigger the circle the higher the sales volumes in city.
Average price percentage changeAverage property price
Bristol house price rank
With the average price of £382k, Bristol is the 20. most pricey city out of 113 England and Wales' cities.
Price ranking
Rank
city
Average price
1.
Inner London
£828k
2.
St Albans
£655k
3.
Oxford
£586k
4.
Cambridge
£574k
5.
Guildford
£572k
6.
Outer London
£564k
7.
Bath
£557k
8.
Woking
£530k
9.
Brighton and Hove
£504k
10.
Watford
£472k
...
20.
Bristol
£382k
...
103.
Scunthorpe
£151k
104.
Darlington
£150k
105.
Kingston upon Hull
£150k
106.
Stockton-on-Tees
£148k
107.
Sunderland
£144k
108.
Middlesbrough
£143k
109.
Blackpool
£141k
110.
Stoke-on-Trent
£141k
111.
Grimsby
£138k
112.
Burnley
£132k
113.
Hartlepool
£131k
Plumplot area insights - interactive charts and maps
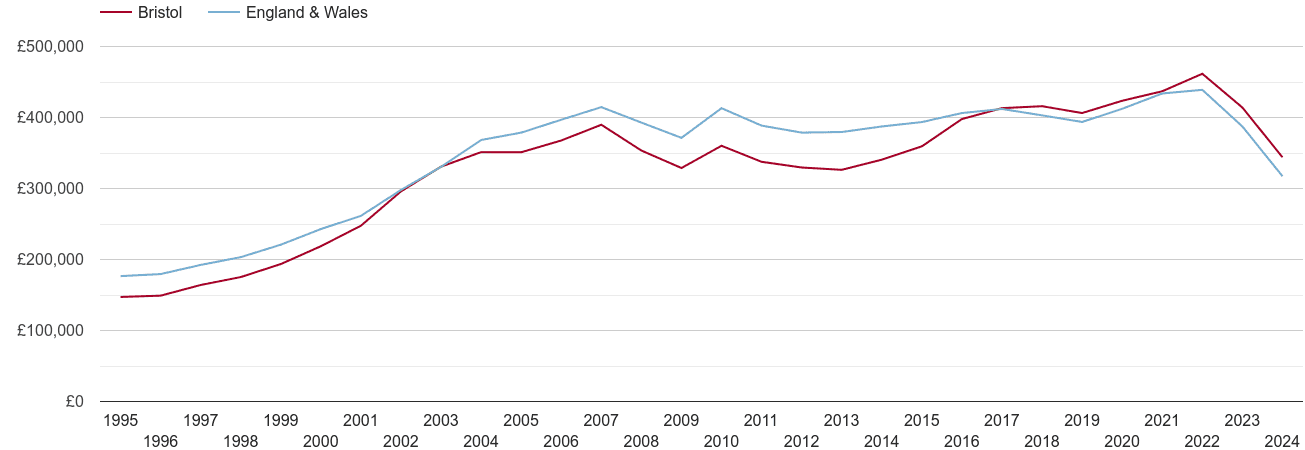
Bristol real house prices
Yearly average nominal house prices adjusted for inflation.
Real average price - nominal price adjusted for inflation
Year
Bristol city
England & Wales
2025
£0
£0
2024
£379k
£348k
2023
£407k
£391k
2022
£457k
£440k
2021
£437k
£434k
2020
£423k
£413k
2019
£406k
£394k
2018
£416k
£403k
2017
£413k
£412k
2016
£398k
£406k
2015
£359k
£394k
2014
£341k
£387k
2013
£326k
£380k
2012
£330k
£379k
2011
£338k
£389k
2010
£360k
£413k
2009
£329k
£371k
2008
£353k
£393k
2007
£390k
£407k
2006
£368k
£389k
2005
£351k
£371k
2004
£351k
£362k
2003
£331k
£330k
2002
£296k
£298k
2001
£248k
£262k
2000
£219k
£243k
1999
£194k
£221k
1998
£175k
£203k
1997
£164k
£192k
1996
£149k
£180k
1995
£147k
£177k
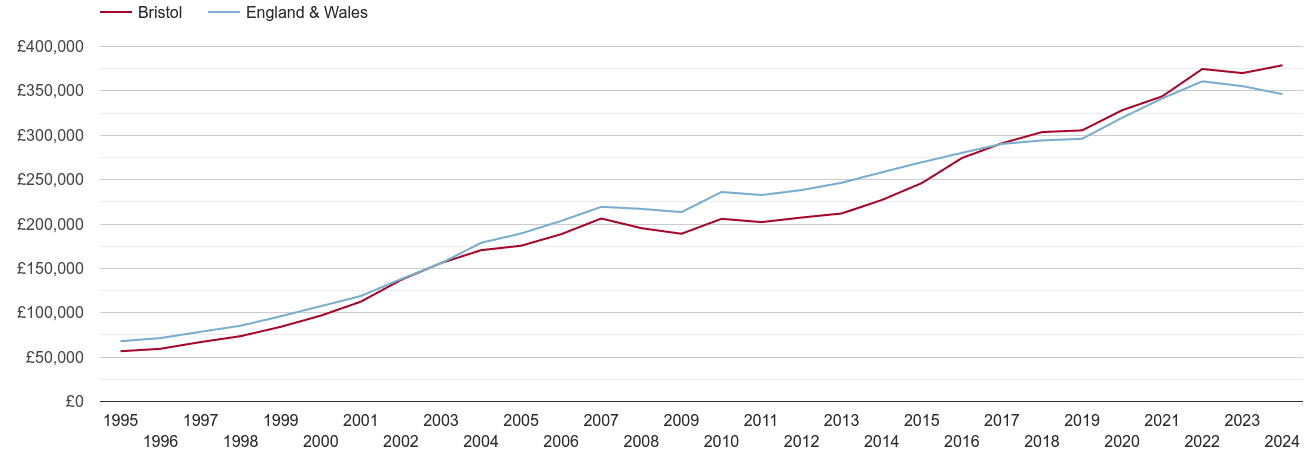
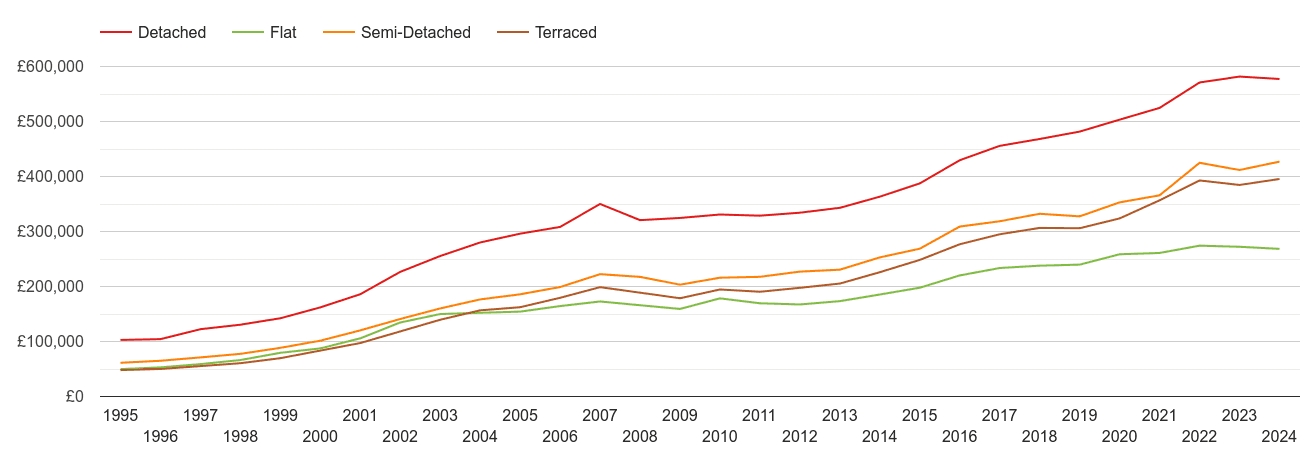
Bristol house prices
Yearly average nominal prices compared to England & Wales' house prices
Nominal average price
Year
Bristol city
England & Wales
2025
£400k
£355k
2024
£379k
£348k
2023
£370k
£356k
2022
£375k
£361k
2021
£344k
£342k
2020
£328k
£320k
2019
£306k
£296k
2018
£304k
£294k
2017
£291k
£290k
2016
£274k
£280k
2015
£246k
£270k
2014
£227k
£258k
2013
£212k
£247k
2012
£207k
£238k
2011
£202k
£233k
2010
£206k
£236k
2009
£189k
£213k
2008
£195k
£217k
2007
£206k
£216k
2006
£189k
£199k
2005
£176k
£186k
2004
£171k
£176k
2003
£156k
£156k
2002
£137k
£138k
2001
£113k
£119k
2000
£96.8k
£108k
1999
£84.2k
£96.0k
1998
£73.6k
£85.4k
1997
£67.0k
£78.5k
1996
£59.4k
£71.5k
1995
£56.6k
£67.9k
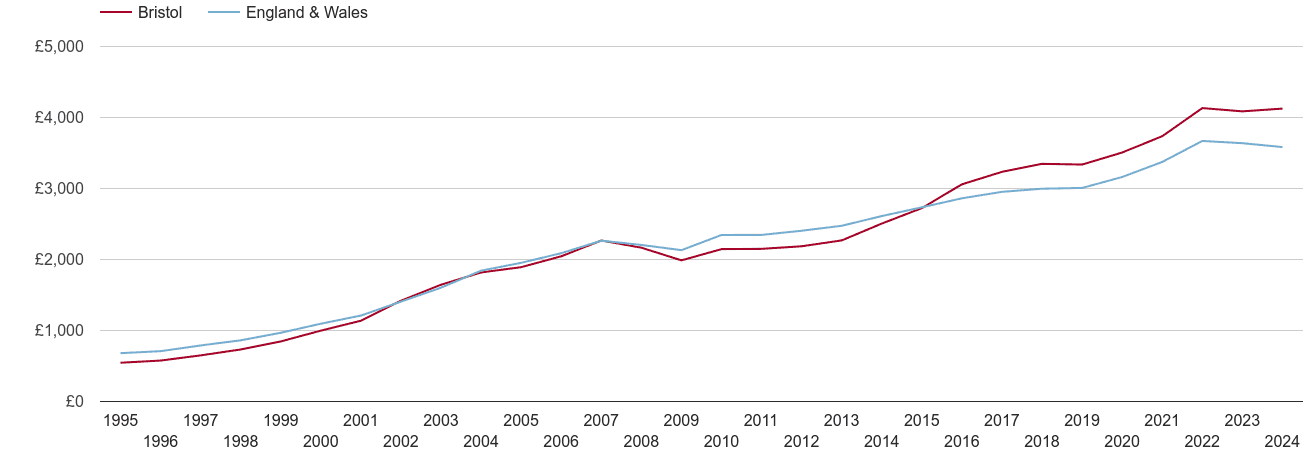
Bristol house prices per square metre
Yearly average nominal price per square metre compared to England & Wales' house prices