Gloucestershire property transactions
There were 10.6k property sales in Gloucestershire county in the previous twelve months and sales dropped by 14.9% (-2.0k transactions). 365 properties, 3.4% were sales of a newly built property. Most properties were sold in the £300k-£400k price range with 2603 (24.5%) properties sold, followed by £250k-£300k price range with 1904 (17.9%) properties sold.
Gloucestershire sales share of new homes and older homes
March 2024 - February 2025
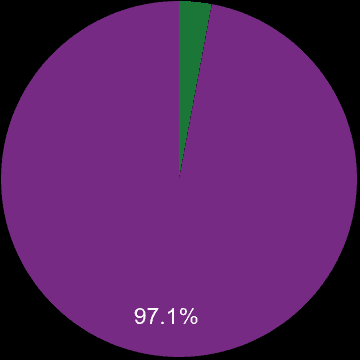
3.4%
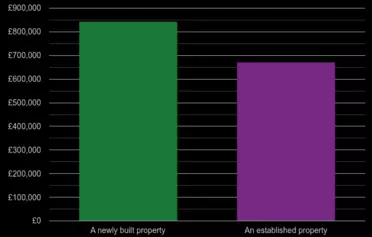
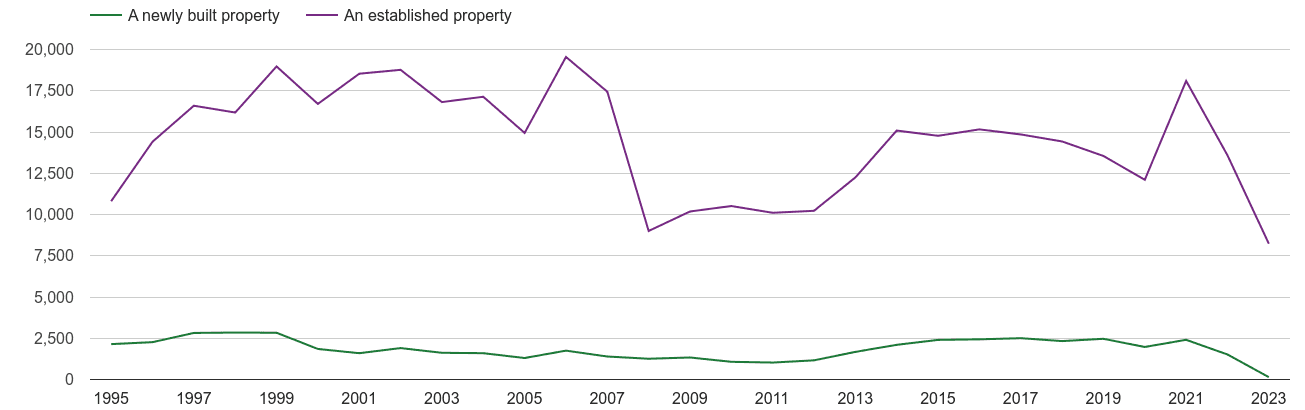
█ A newly built property365
96.6%
█ An established property10.3k
10.6k
total sales volumeGloucestershire sales share of houses and flats
March 2024 - February 2025
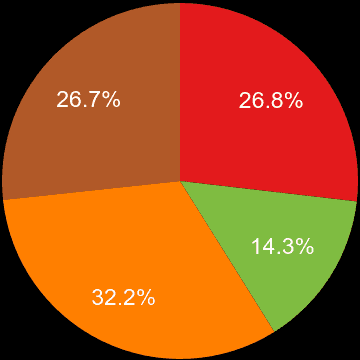
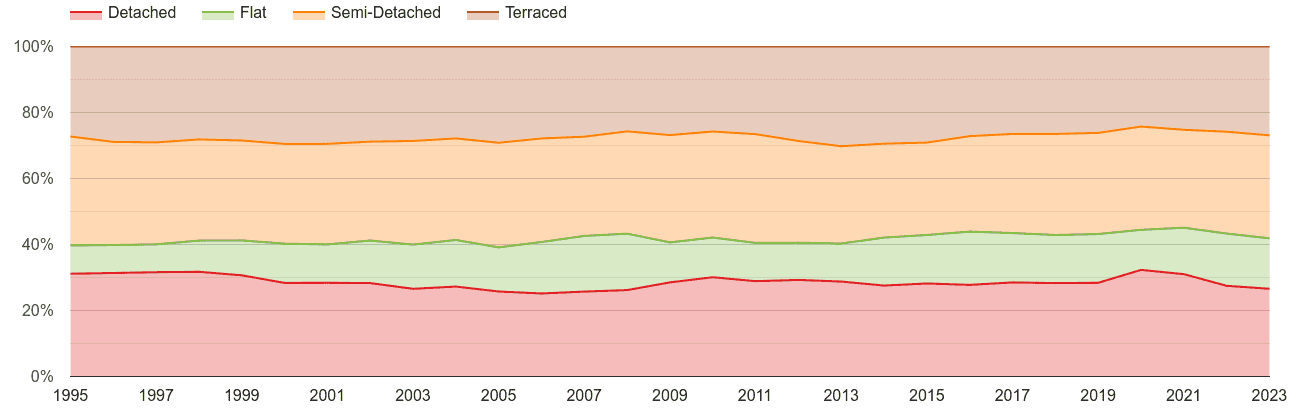
28.3%
█ Detached3.0k
13.4%
█ Flat1.4k
31.0%
█ Semi-Detached3.3k
27.4%
█ Terraced2.9k
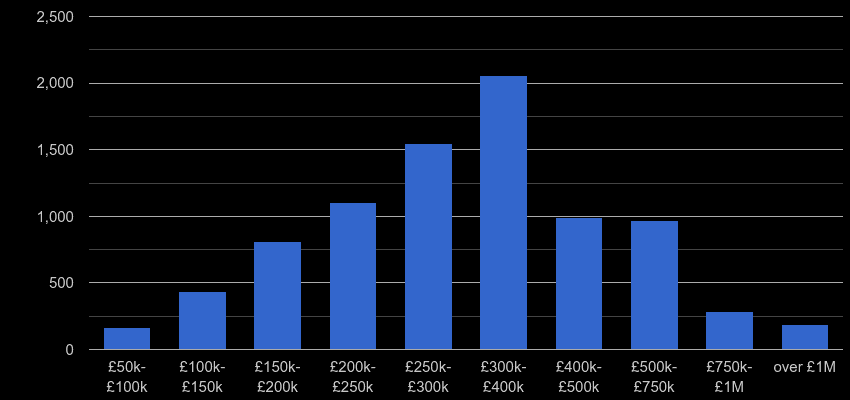
Gloucestershire property sales by price range
shows a number of properties sold in a given price range between March 2024 - February 2025.
| Property price range | Market share | Sales volume |
|---|
| £50k-£100k | 1.6% | 169 |
| £100k-£150k | 4.6% | 486 |
| £150k-£200k | 8.9% | 946 |
| £200k-£250k | 13.8% | 1.5k |
| £250k-£300k | 17.9% | 1.9k |
| £300k-£400k | 24.5% | 2.6k |
| £400k-£500k | 12.1% | 1.3k |
| £500k-£750k | 11.3% | 1.2k |
| £750k-£1M | 3.4% | 364 |
| over £1M | 2.0% | 210 |
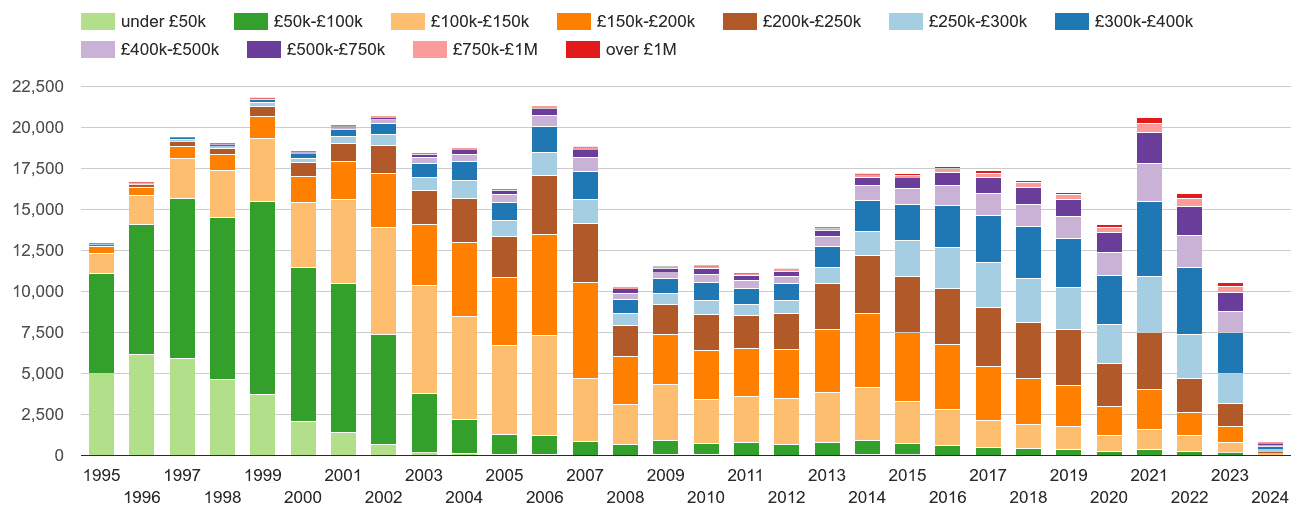
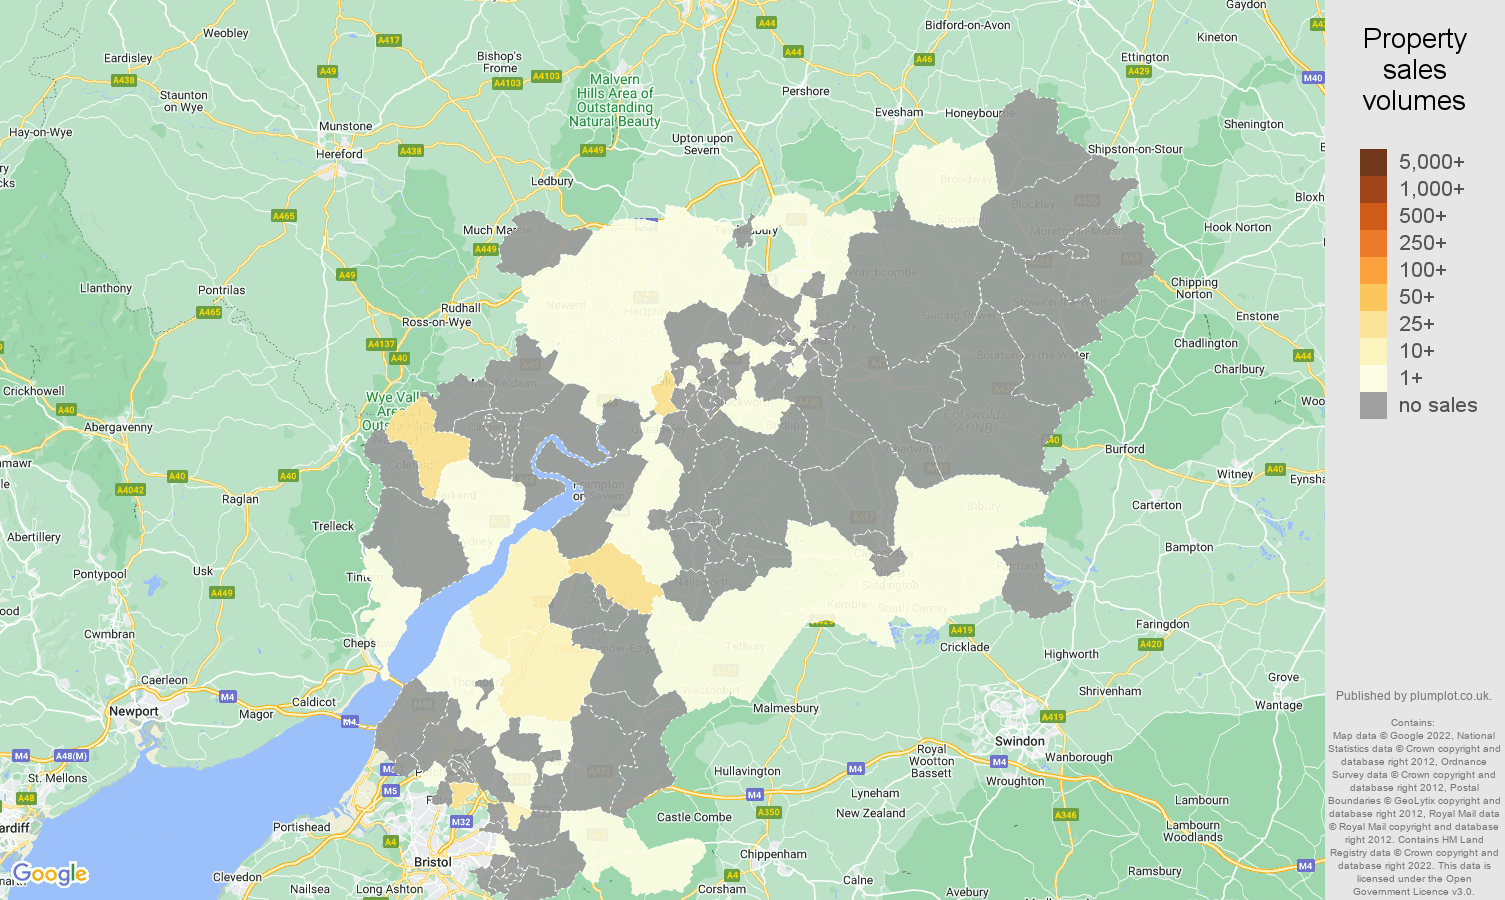
Gloucestershire property sales volumes
Yearly property sales volume by nominal price ranges
Gloucestershire annual sales of new homes and older homes
Total sales volume by year
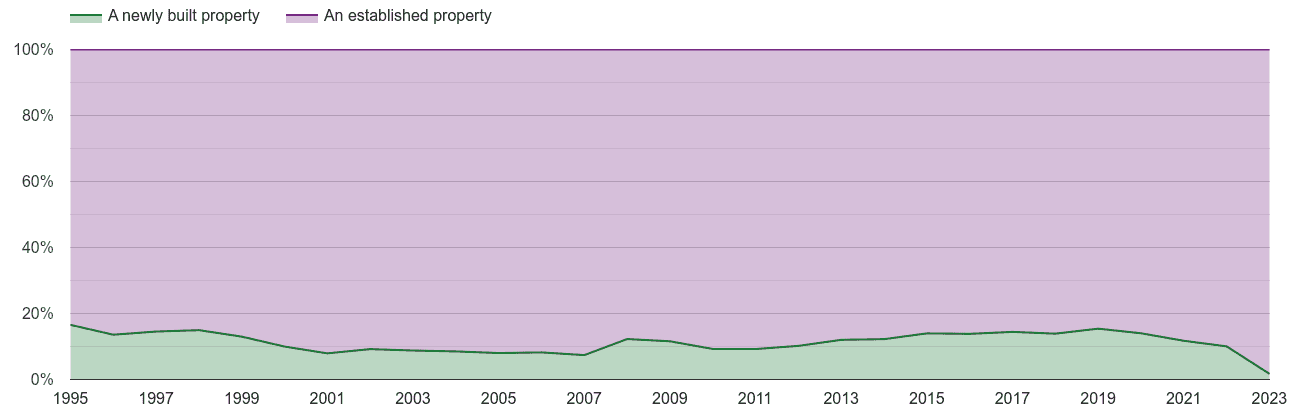
Gloucestershire annual sales share of new homes and older homes
Market share by year
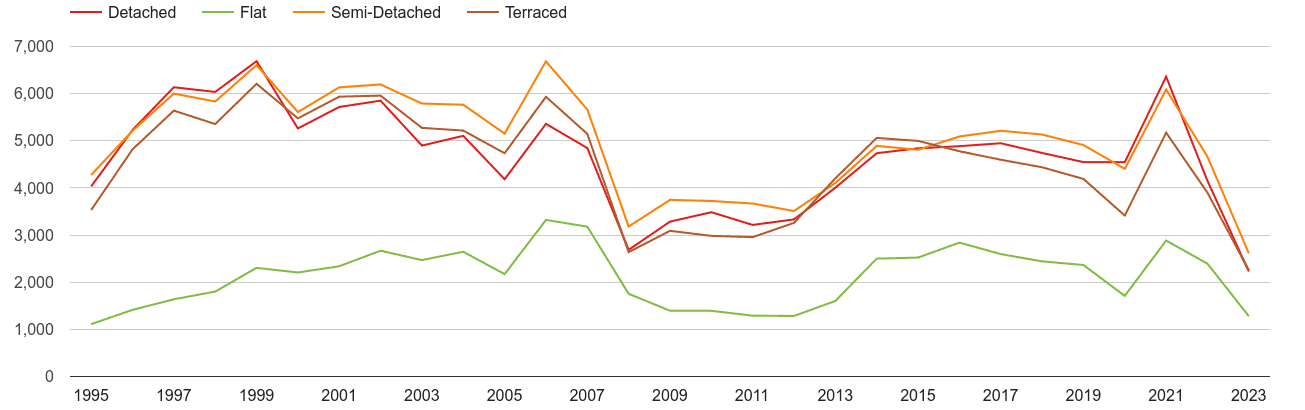
Gloucestershire annual sales of houses and flats
Total sales volumes by year
Gloucestershire annual sales share of houses and flats
Market share by year
Gloucestershire map of sales of new properties
shows the total volume of new properties sold a given postcode sector.
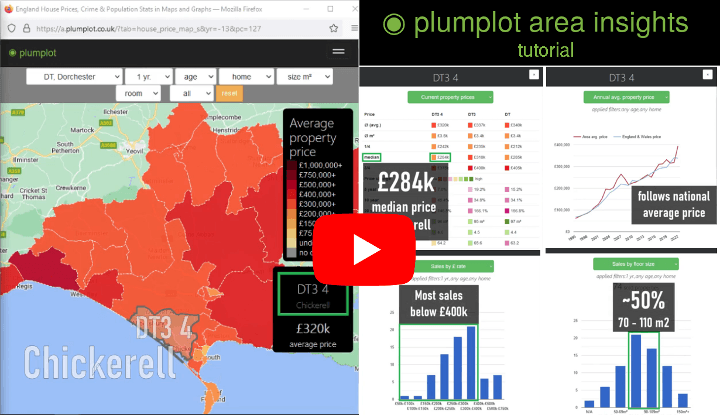
Plumplot area insights - interactive charts and maps
Next for Gloucestershire county


 login →