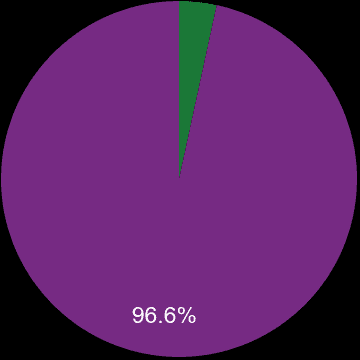
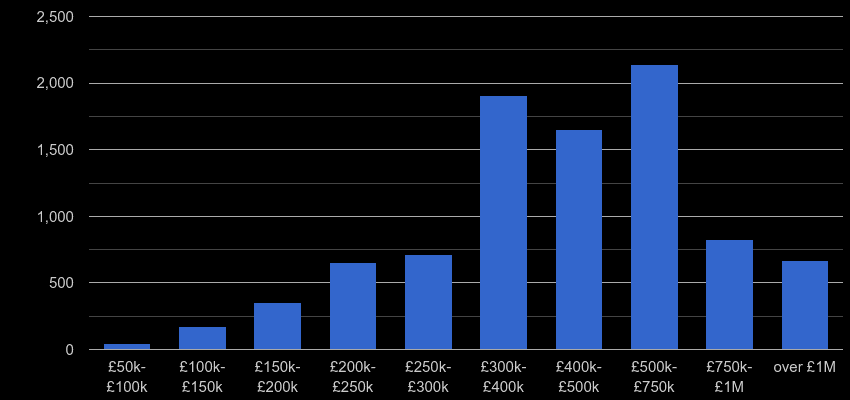
There were 11.8k property sales in Hertfordshire county in the previous twelve months and sales dropped by 12.6% (-1.8k transactions). 302 properties, 2.6% were sales of a newly built property. Most properties were sold in the £500k-£750k price range with 2860 (24.3%) properties sold, followed by £300k-£400k price range with 2428 (20.6%) properties sold.


| Property price range | Market share | Sales volume |
|---|---|---|
| £50k-£100k | 0.5% | 59 |
| £100k-£150k | 1.8% | 212 |
| £150k-£200k | 3.5% | 416 |
| £200k-£250k | 7.0% | 818 |
| £250k-£300k | 7.5% | 888 |
| £300k-£400k | 20.6% | 2.4k |
| £400k-£500k | 19.2% | 2.3k |
| £500k-£750k | 24.3% | 2.9k |
| £750k-£1M | 9.3% | 1.1k |
| over £1M | 6.3% | 737 |
Yearly property sales volume by nominal price ranges

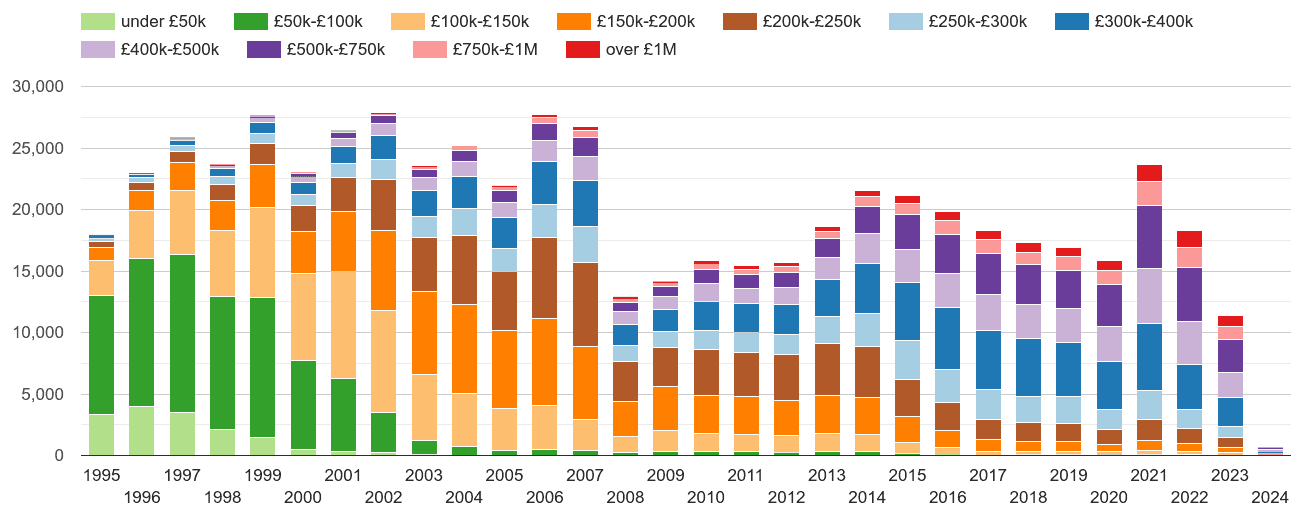
Total sales volume by year

Market share by year

Total sales volumes by year

Market share by year

shows the total volume of new properties sold a given postcode sector.