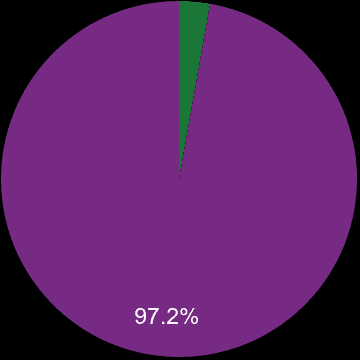
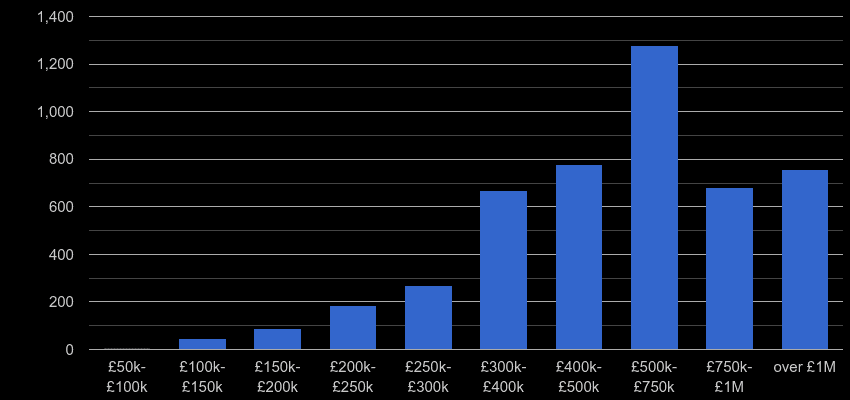
There were 6.1k property sales in Kingston upon Thames postcode area in the previous twelve months and sales dropped by 16.4% (-1.3k transactions). 143 properties, 2.3% were sales of a newly built property. Most properties were sold in the £500k-£750k price range with 1845 (30.2%) properties sold, followed by £400k-£500k price range with 1068 (17.5%) properties sold.

| New or established | Percentage share | Sales volume |
|---|---|---|
| █ A newly built property | 2.3% | 143 |
| █ An established property | 97.7% | 6.0k |
| All properties | 100% | 6.1k |

| House Type | Percentage share | Sales volume |
|---|---|---|
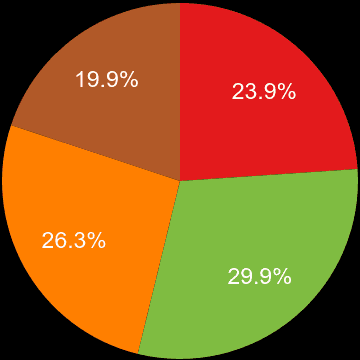
| █ Detached | 20.2% | 1.2k |
| █ Flat | 31.4% | 1.9k |
| █ Semi-Detached | 27.1% | 1.7k |
| █ Terraced | 21.3% | 1.3k |

| Property price range | Market share | Sales volume |
|---|---|---|
| £50k-£100k | 0.1% | 8 |
| £100k-£150k | 0.9% | 54 |
| £150k-£200k | 1.7% | 101 |
| £200k-£250k | 3.9% | 237 |
| £250k-£300k | 6.0% | 366 |
| £300k-£400k | 14.4% | 878 |
| £400k-£500k | 17.5% | 1.1k |
| £500k-£750k | 30.2% | 1.8k |
| £750k-£1M | 14.5% | 886 |
| over £1M | 10.9% | 668 |
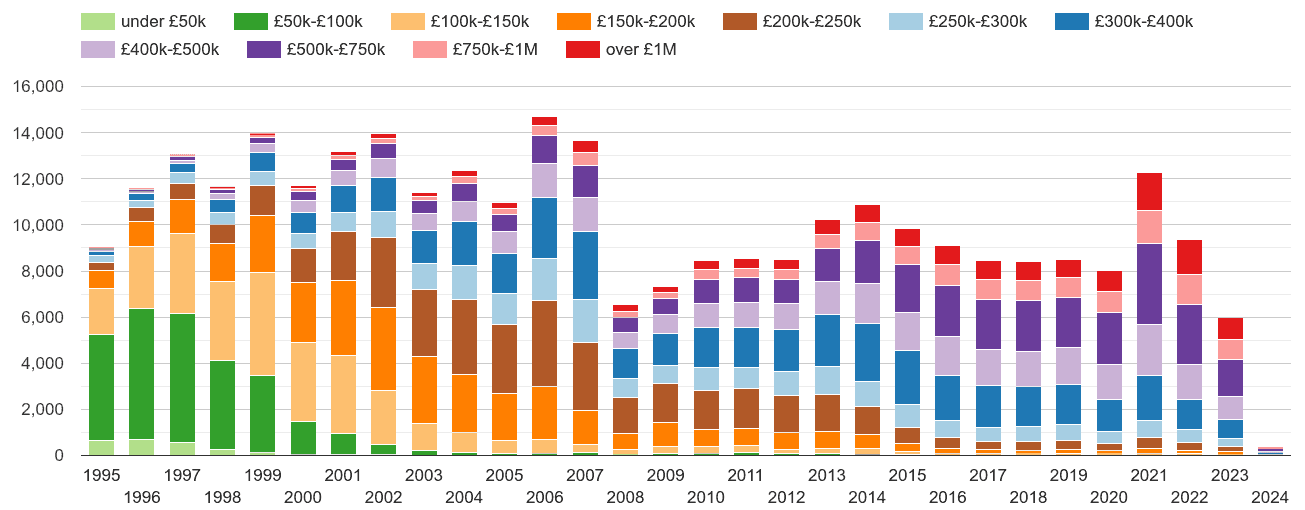
Yearly property sales volume by nominal price ranges

Total sales volume by year

Market share by year

Total sales volumes by year

Market share by year

shows the total volume of new properties sold a given postcode sector.