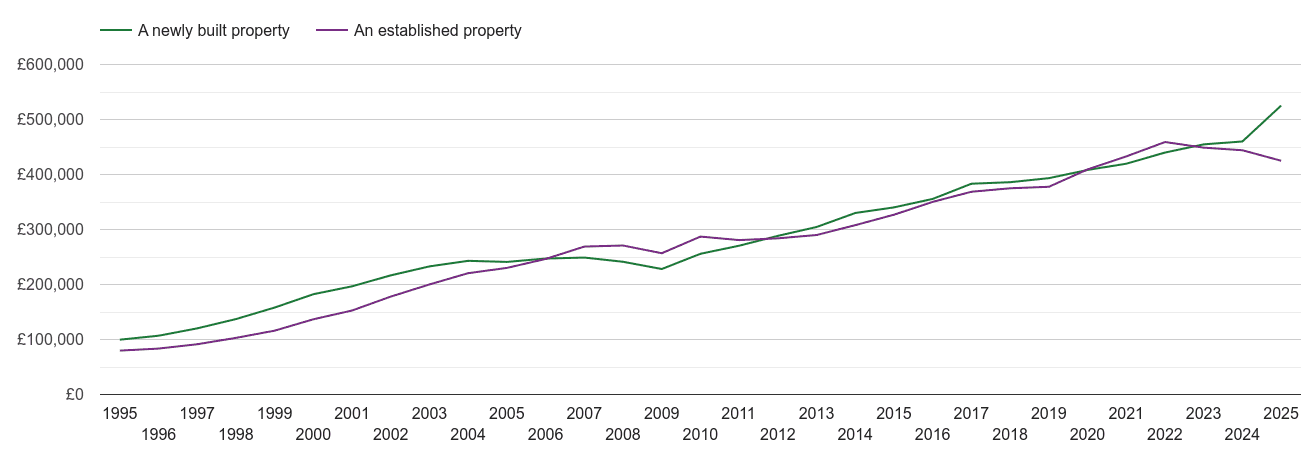
The price of a newly built property is £467k in South East region. The price increased by £7.2k (2%) over the last twelve months. The price of an established property is £440k. There were 3170 sales of newly build properties. Most new properties were sold in the £300k-£400k price range with 856 (27.0%) properties sold, followed by £500k-£750k price range with 855 (27.0%) properties sold. Most new homes were sold in Kent, with 862 sold to date from March 2024 - February 2025.
| March 2024 - February 2025 | South East region | England & Wales |
|---|---|---|
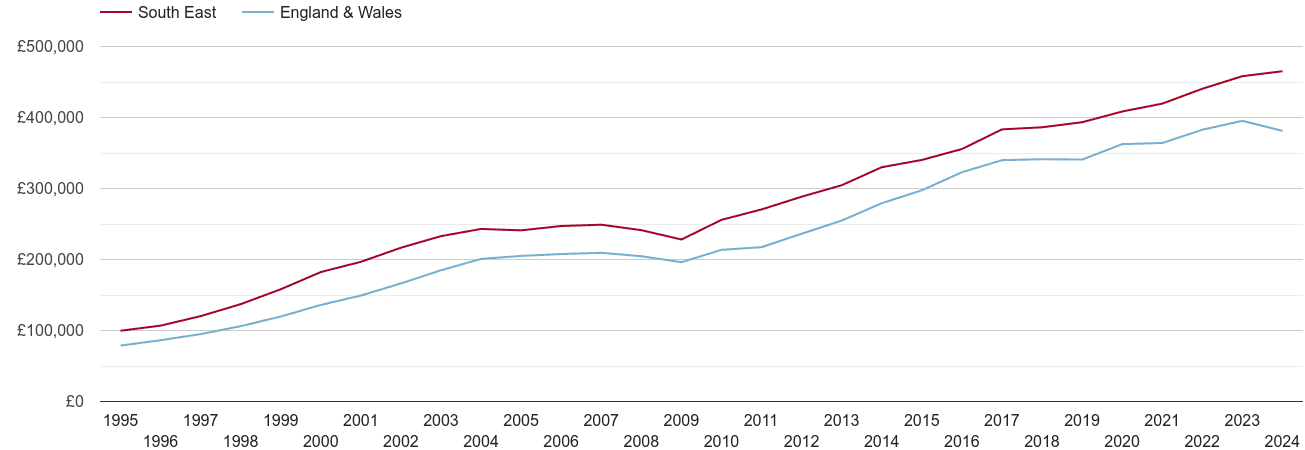
| Average price of a new home | £467k | £379k |
Average price change | 2% £7.2k | -4% £-17.8k |
March 2024 - February 2025
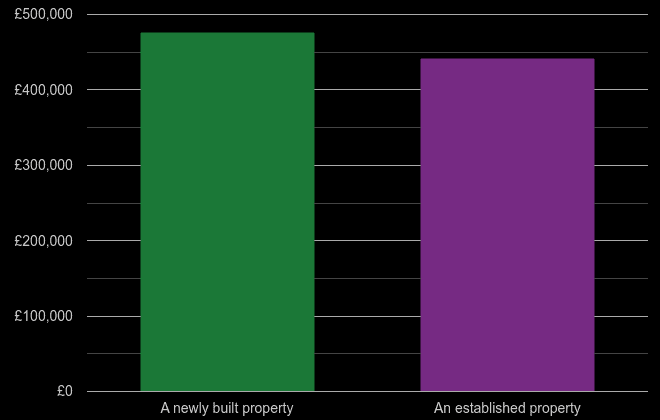
| New or established | Average price |
|---|---|
| █ A newly built property | £467k |
| █ An established property | £440k |
March 2024 - February 2025

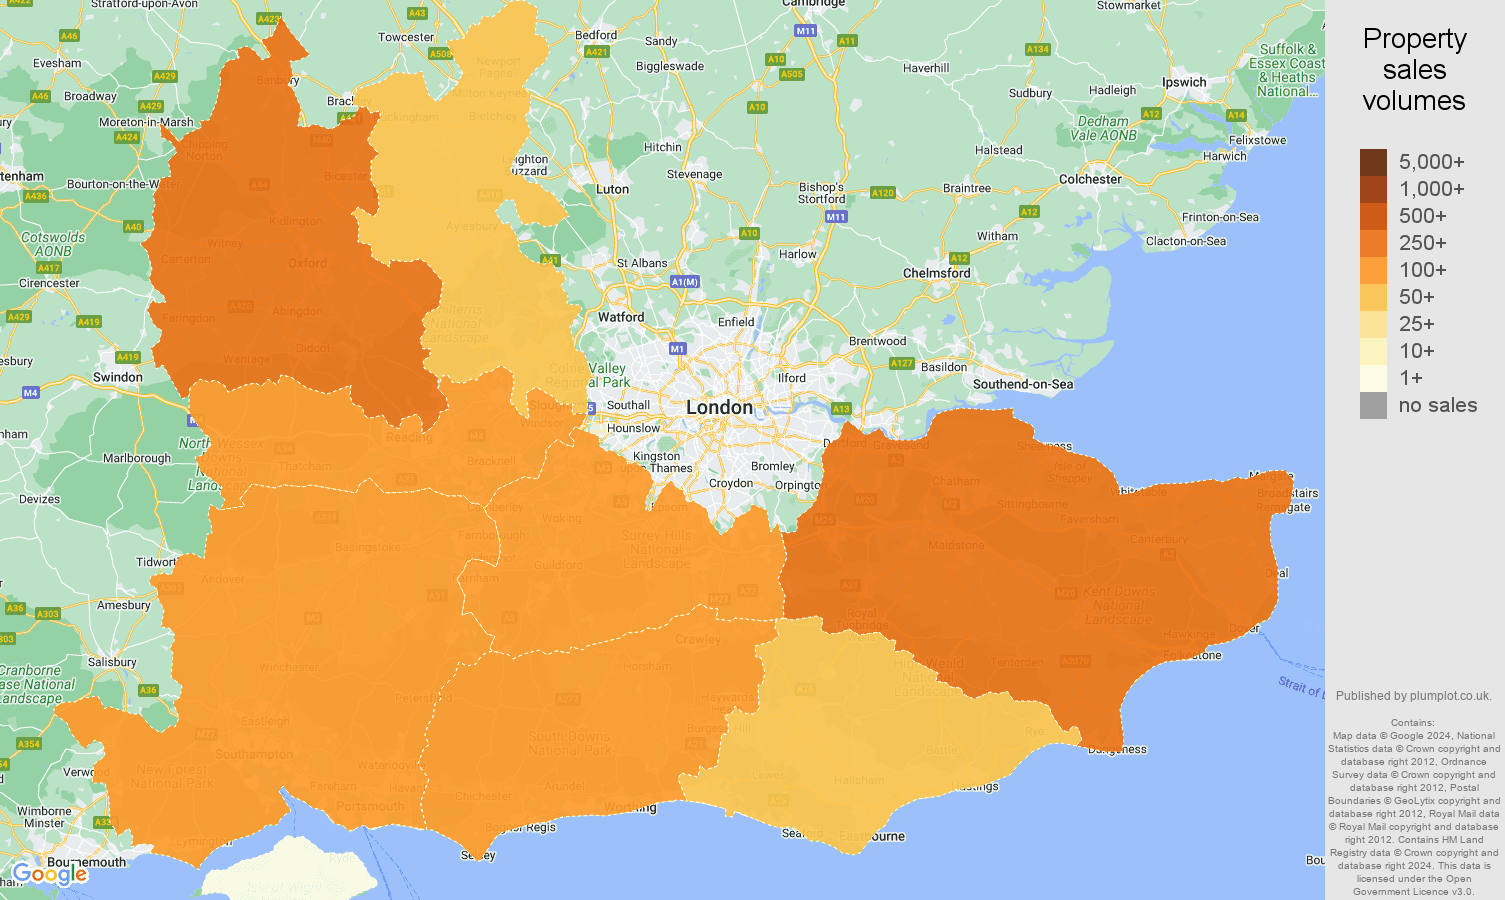
shows the total volume of new homes sold a given county.
| County | Sales volume | Market share | |
|---|---|---|---|
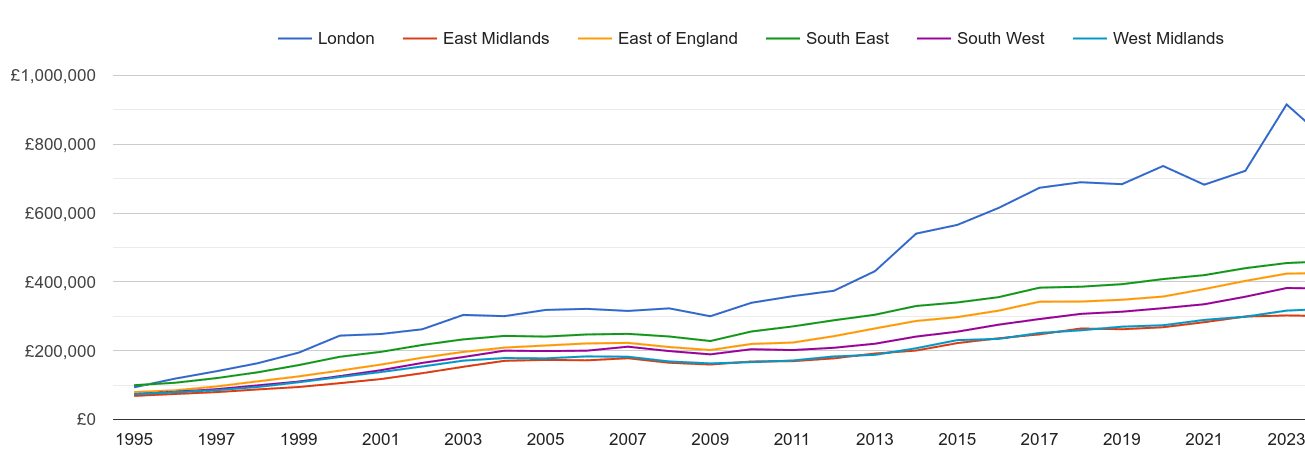
| Berkshire | 315 | 9.9% | |
| Buckinghamshire | 390 | 12.3% | |
| East Sussex | 126 | 4% | |
| Hampshire | 497 | 15.7% | |
| Isle of Wight | 3 | 0.1% | |
| Kent | 862 | 27.2% | |
| Oxfordshire | 432 | 13.6% | |
| Surrey | 207 | 6.5% | |
| West Sussex | 338 | 10.7% | |
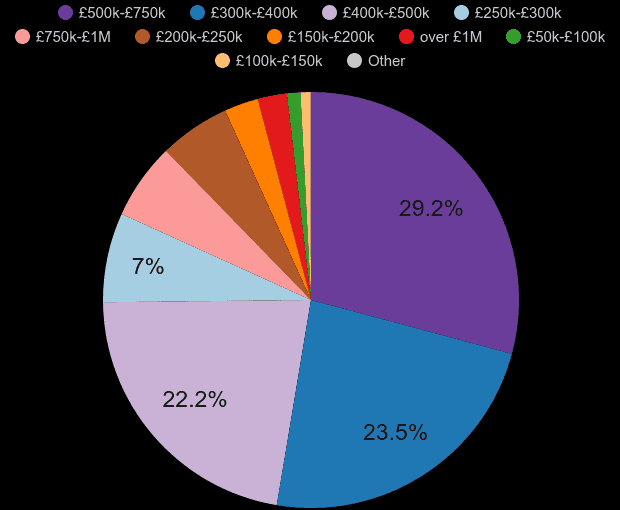
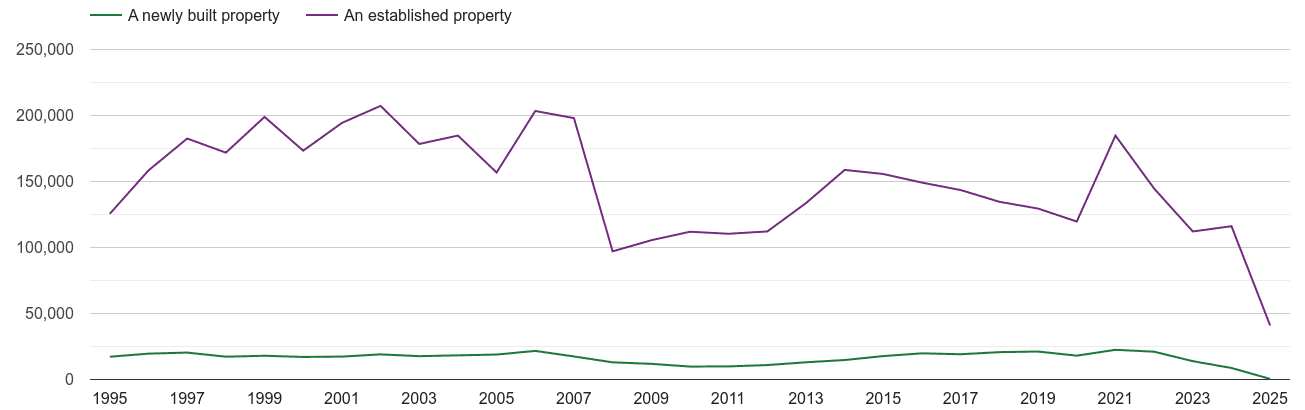
shows a sales volume of new homes in a given price range between March 2024 - February 2025. See also South East property sales reports.
| Property price range | Market share | Sales volume |
|---|---|---|
| █ £50k-£100k | 0.2% | 5 |
| █ £100k-£150k | 0.4% | 14 |
| █ £150k-£200k | 1.8% | 57 |
| █ £200k-£250k | 4.7% | 150 |
| █ £250k-£300k | 7.5% | 238 |
| █ £300k-£400k | 27.0% | 856 |
| █ £400k-£500k | 25.1% | 795 |
| █ £500k-£750k | 27.0% | 855 |
| █ £750k-£1M | 4.8% | 151 |
| █ over £1M | 1.5% | 49 |
March 2024 - February 2025
March 2024 - February 2025
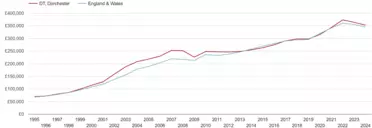
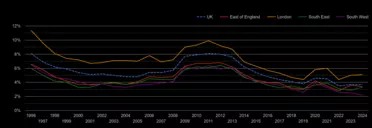
Yearly average nominal house prices adjusted for inflation

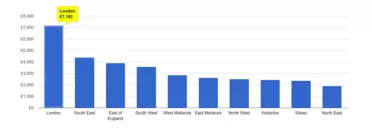
Yearly average nominal prices
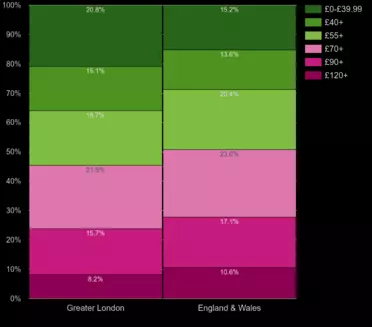
Yearly average nominal prices
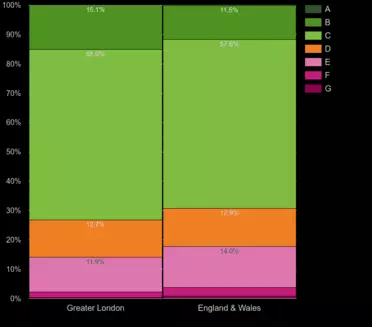
Yearly average nominal prices
Total sales volumes by year

 login →