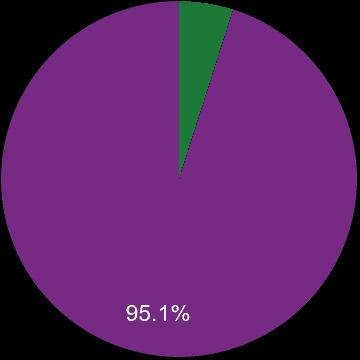
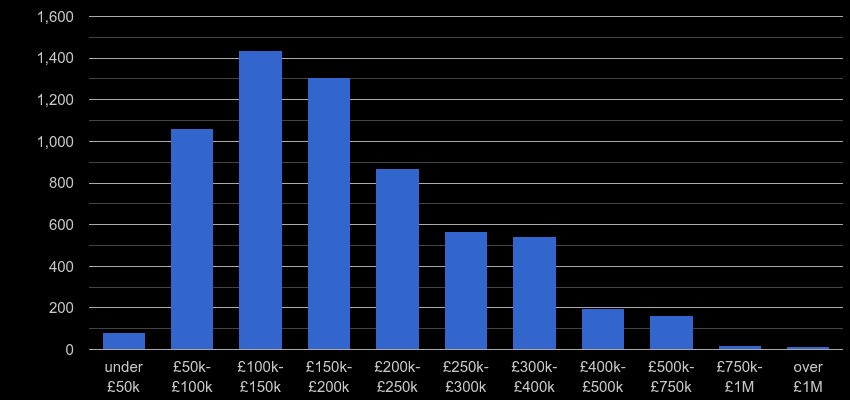
There were 8.0k property sales in Stoke-on-Trent postcode area in the previous twelve months and sales dropped by 12.9% (-1.3k transactions). 422 properties, 5.3% were sales of a newly built property. Most properties were sold in the £150k-£200k price range with 1744 (21.9%) properties sold, followed by £100k-£150k price range with 1602 (20.1%) properties sold.

| New or established | Percentage share | Sales volume |
|---|---|---|
| █ A newly built property | 5.3% | 422 |
| █ An established property | 94.7% | 7.6k |
| All properties | 100% | 8.0k |

| House Type | Percentage share | Sales volume |
|---|---|---|
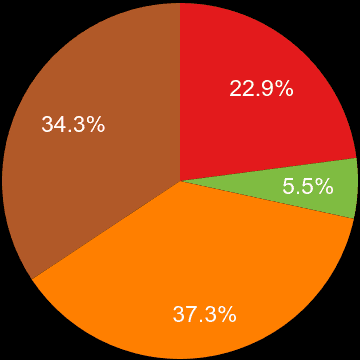
| █ Detached | 26.9% | 2.1k |
| █ Flat | 5.5% | 441 |
| █ Semi-Detached | 38.5% | 3.1k |
| █ Terraced | 29.1% | 2.3k |

| Property price range | Market share | Sales volume |
|---|---|---|
| under £50k | 0.7% | 56 |
| £50k-£100k | 11.8% | 943 |
| £100k-£150k | 20.1% | 1.6k |
| £150k-£200k | 21.9% | 1.7k |
| £200k-£250k | 15.4% | 1.2k |
| £250k-£300k | 11.1% | 888 |
| £300k-£400k | 11.4% | 908 |
| £400k-£500k | 4.4% | 350 |
| £500k-£750k | 2.6% | 211 |
| £750k-£1M | 0.5% | 39 |
| over £1M | 0.0% | 3 |
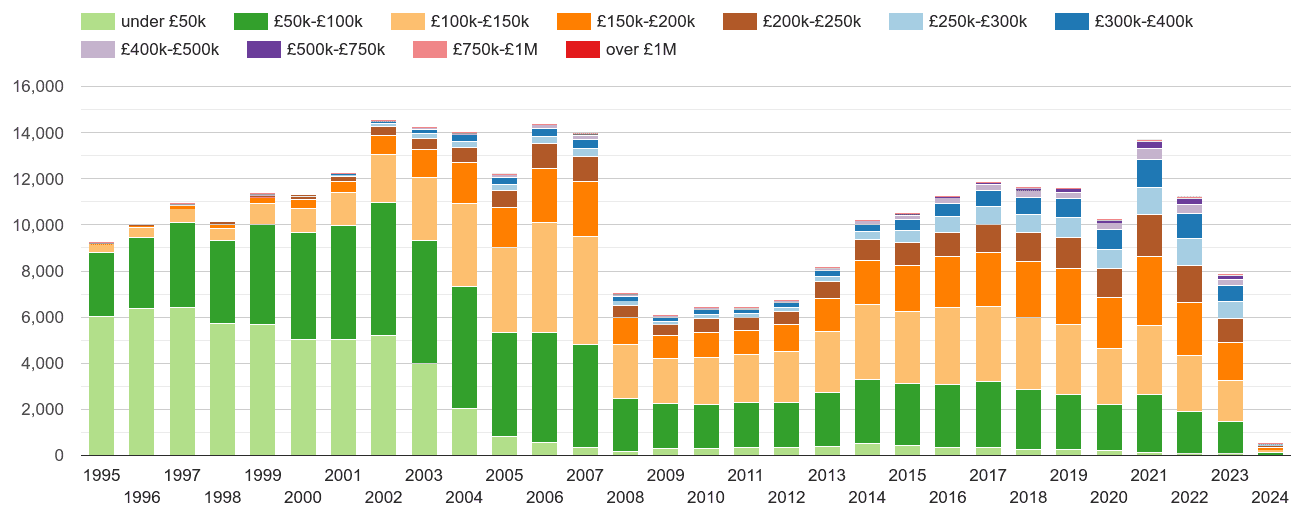
Yearly property sales volume by nominal price ranges

Total sales volume by year

Market share by year

Total sales volumes by year

Market share by year

shows the total volume of new properties sold a given postcode sector.