Current and potential energy ratings of homes
Energy Performance Certificate is a rating scheme that assesses the building and summarises its energy efficiency. It is measured by a government specialist, who checks key items in your home like insulation, boiler, radiator, windows, an age of the building etc. and then uses specialised software to determine the property’s final rating.
Once assessed, the property is given two different ratings - the property’s current energy rating and the potential energy rating. Current energy rating of a property is a measurement of its energy efficiency - and according to this, the properties are divided into groups ranging from A to G (A being the most energy efficient, G being the least efficient). Potential energy rating is then calculated by estimating the energy efficiency of the property after some energy-saving measures have been taken.
And even though the energy usage of the appliances isn’t rated in the Energy Performance Certificate, the maintenance cost of an energy-inefficient house is still a considerable one. It is useful to be informed about the Energy Efficiency Rating of the building one lives in or considers buying, simply because it can save you money not only in the short but also in the long run. On top of the lower costs, energy-efficient houses have smaller added environmental impact, so much sought for these days.
Energy costs money and the more the property uses, the higher the bill. This is where the Energy Performance Certificate comes to play.
The most frequent energy ratings of buildings
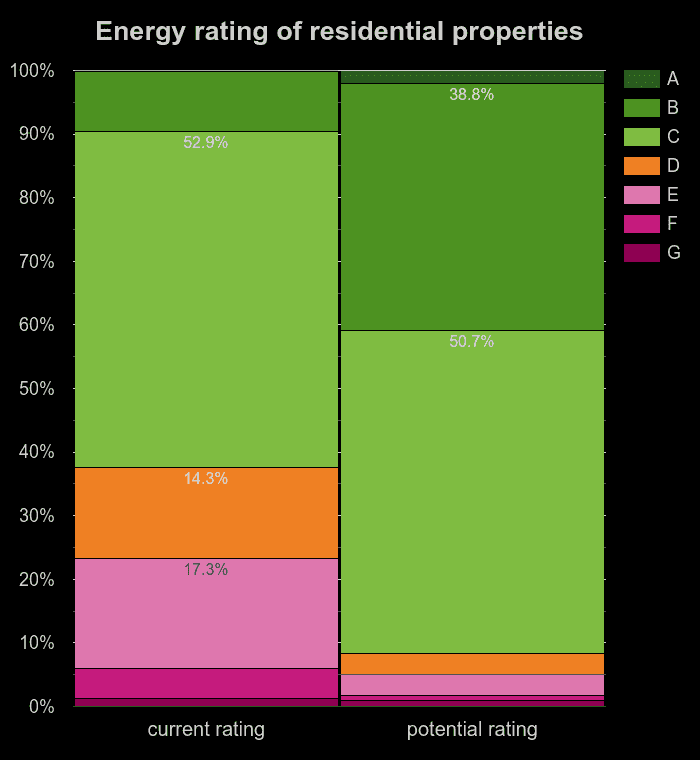
In the period from 2008 to 2016, the Ministry of Housing, Communities, and Local Government measured the energy efficiency for about half of all housing units in England and Wales. More than 16M energy certificates were issued for over 12M unique addresses. Provided data is presented in the charts below.

In the chart above, houses and flats are grouped together. The first column shows the energy rating and the second one the potential energy rating. The largest groups by current energy rating are C: 52.9%, followed by D: 14.3%, E: 17.3% and B: 9,5%.
But as we mentioned before, these numbers is only part of the energy rating - if the property owner chooses to follow the government recommendations provided in the Energy Rating Certificate and install some energy-saving measures, the property’s energy rating changes, which is why the potential energy rating is important for comparison.
The largest groups by potential energy rating were C: 50,7% and B: 38,8%. The aforementioned groups D and E almost disappearing from the chart means that the majority of the homes in these groups can be significantly improved by energy-saving measures and thus become more energy-efficient.
Energy ratings of flats and houses
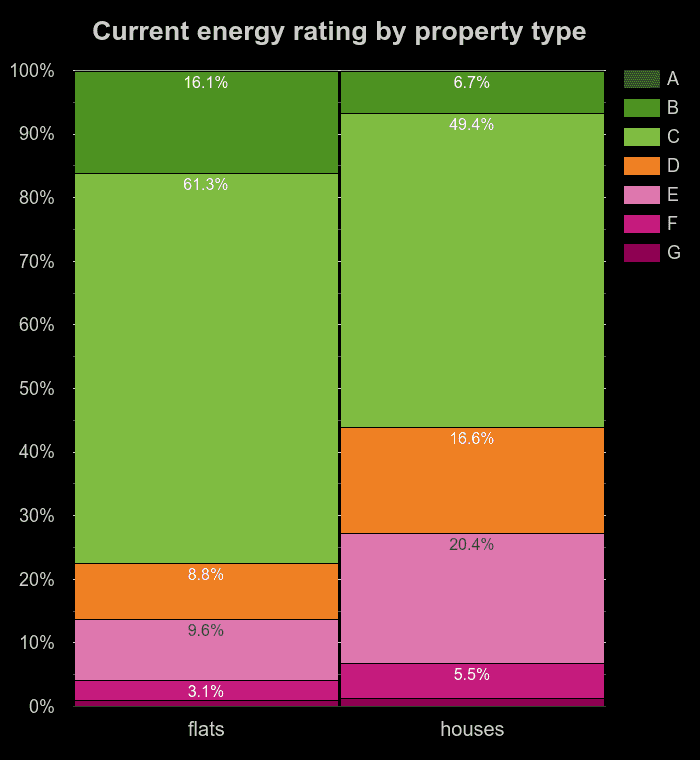
The next chart compares the energy rating of houses to the energy rating of flats:

As we can see, flats are more energy efficient - C with 61,3% being the largest group, followed by B with 16,1 %. Houses, compared to flats, are currently much less energy efficient - C: 49,4%, E: 20,4% and D: 16,6%.
Potential energy ratings of flats and houses
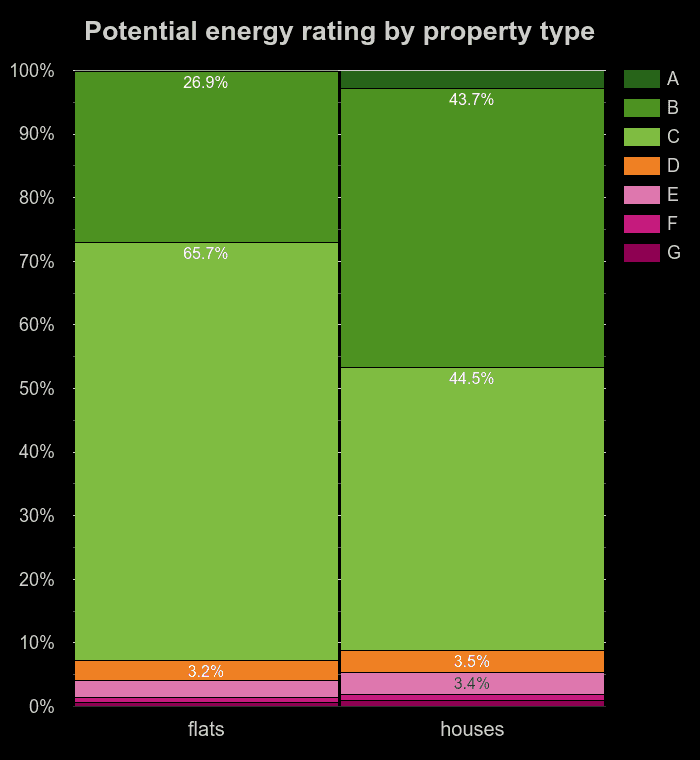
But in the context of potential energy rating, flats have one disadvantage - as can be seen in the following chart comparing potential energy rating of flats and houses.

Sometimes it is not possible for flats to employ any additional energy-saving measures, making them less energy efficient in the long run. The largest groups of flats by potential energy rating are still C: 65,7% and B: 26,9%. Only 0.1% of flats can potentially get A rating. The potential energy ratings of houses are, on the other hand, C: 44,5%, B: 43,7% and A: 2.9%, showing, again, that houses have good opportunities for improvement.
Contains public sector information licensed under the Open Government Licence v3.0.. Datasource: Energy Performance of Buildings Data