Wales and England housing market
×
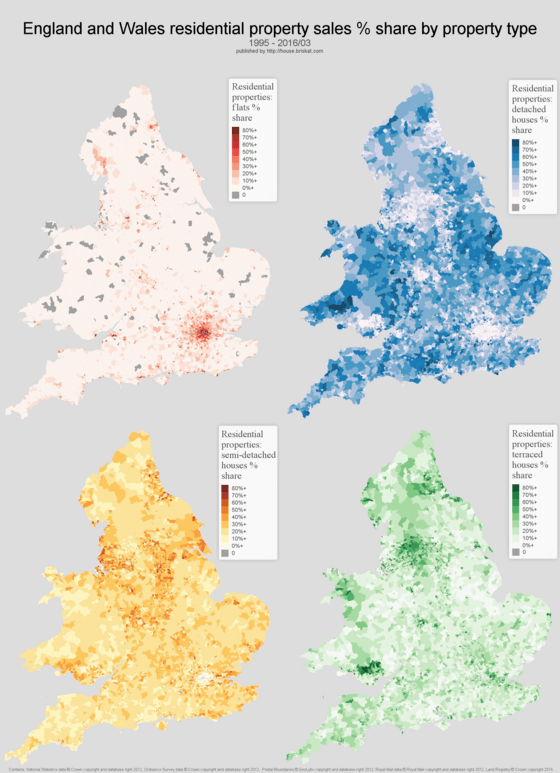
Residential property sales by property type
Flat ~ apartment, detached house ~ single family home, semi-detached house ~ duplex, terraced house ~ townhouse
Property prices compared to 2007
The average price grew most from 2007 to 2015 in Greater London and adjacent areas. Many areas in northern England and in Wales were in 2015 still on or below 2007 nominal price levels.
UK property prices and sales volumes compared to 2007
Comparison of postcode areas and their property prices % change and sales volumes % change
Maps of annual property prices in England and Wales
Animated market dynamics of nominal average property prices from 1995 till 2015
England and Wales annual property prices
Market dynamics by postcode area displayed on historical nominal prices from 1995 to March 2016
England and Wales burglary crime rate
Number of burglaries per 1000 residents in the five-year period from 2011 to 2016/2
England and Wales population density
Census 2011
Contains public sector information licensed under the Open Government Licence v3.0., National Statistics data © Crown copyright and database right 2012, Ordnance Survey data © Crown copyright and database right 2012, Postal Boundaries © GeoLytix copyright and database right 2012, Royal Mail data © Royal Mail copyright and database right 2012 . Data sources: Price Paid Data , UK police data , UK Census 2011 .

