Ipswich home energy efficiency
June 2023
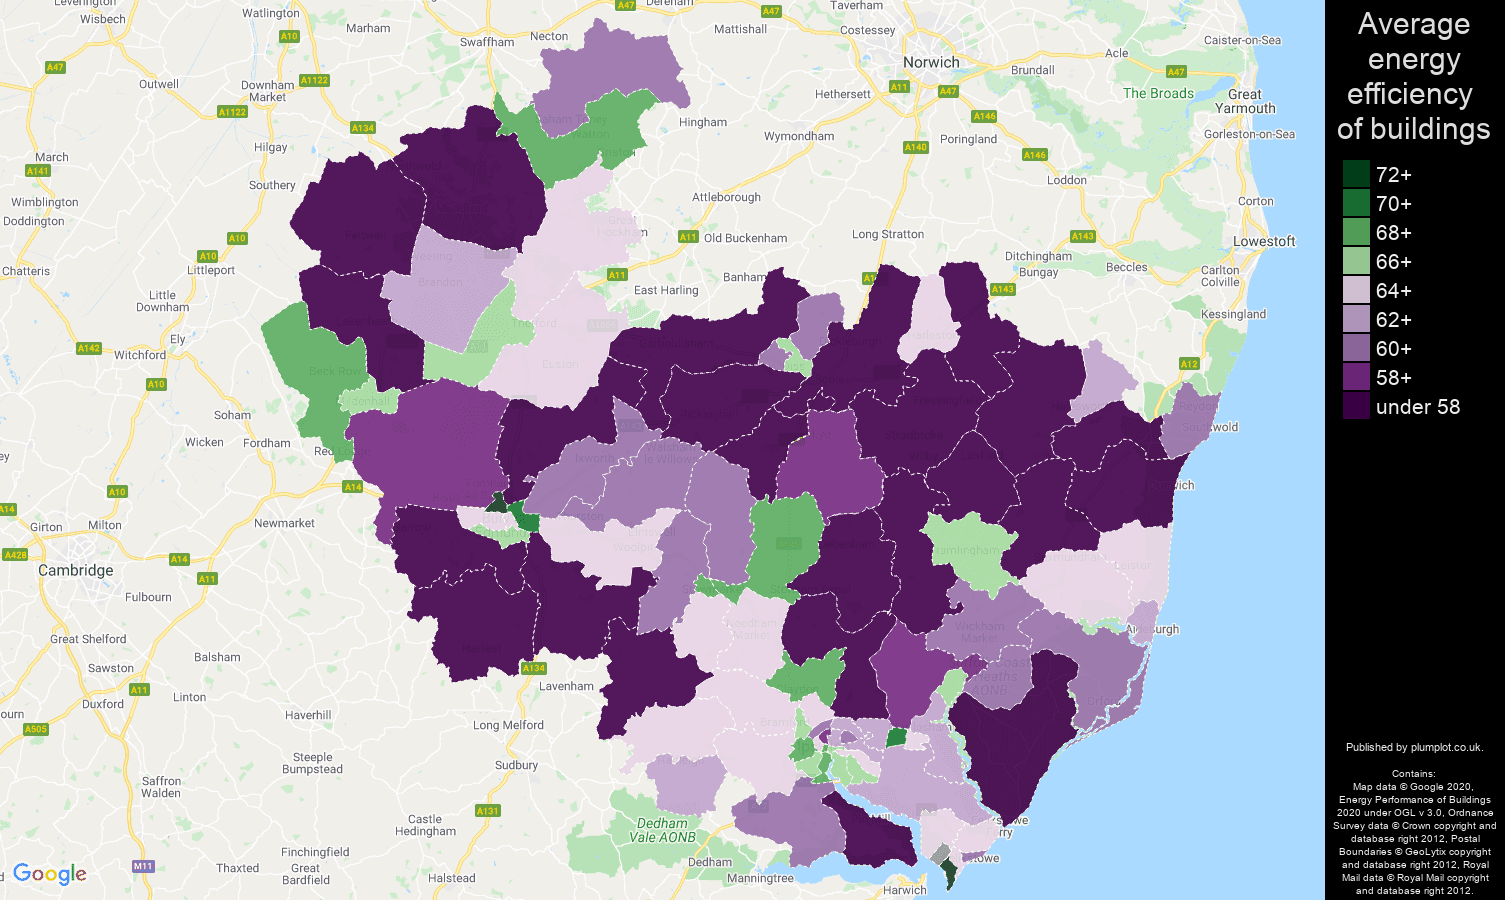
Residential buildings are ordinary efficient. The average home energy rating in Ipswich postcode area is 64.3, D rating. This is by 0.8 worse score than the average home energy rating in England and Wales. The average potential rating is 79.9, C rating.
Ipswich homes by energy rating
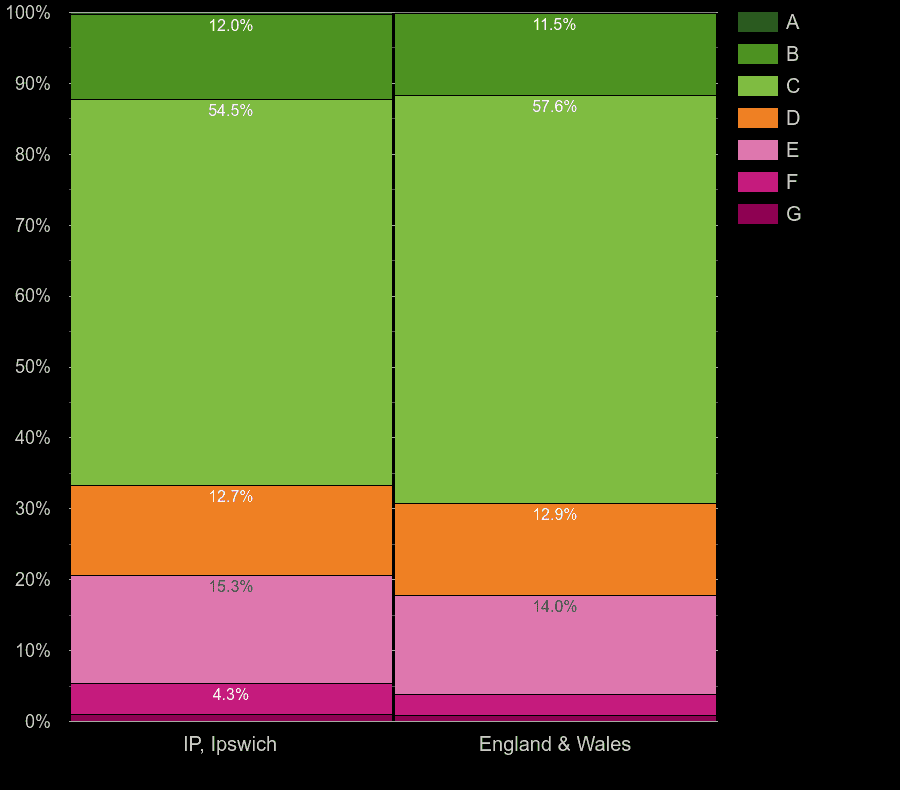
| Energy rating | Ipswich | England & Wales |
|---|
| █ A | 0.2% | 0.1% |
| █ B | 12.0% | 11.5% |
| █ C | 54.5% | 57.6% |
| █ D | 12.7% | 12.9% |
| █ E | 15.3% | 14.0% |
| █ F | 4.3% | 3.0% |
| █ G | 1.0% | 0.8% |
Ipswich map of energy efficiency of properties
Ipswich homes by potential energy rating
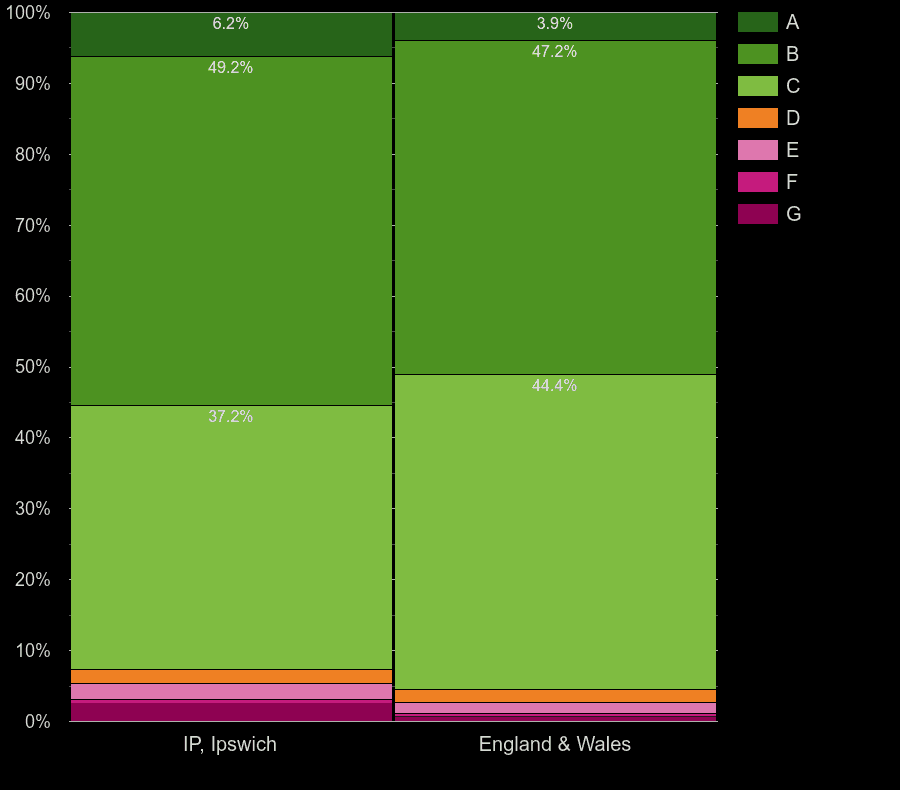
| Potential energy rating | Ipswich | England & Wales |
|---|
| █ A | 6.2% | 3.9% |
| █ B | 49.2% | 47.2% |
| █ C | 37.2% | 44.4% |
| █ D | 2.0% | 1.8% |
| █ E | 2.2% | 1.6% |
| █ F | 0.7% | 0.4% |
| █ G | 2.5% | 0.7% |
Ipswich homes by main heating control energy efficiency
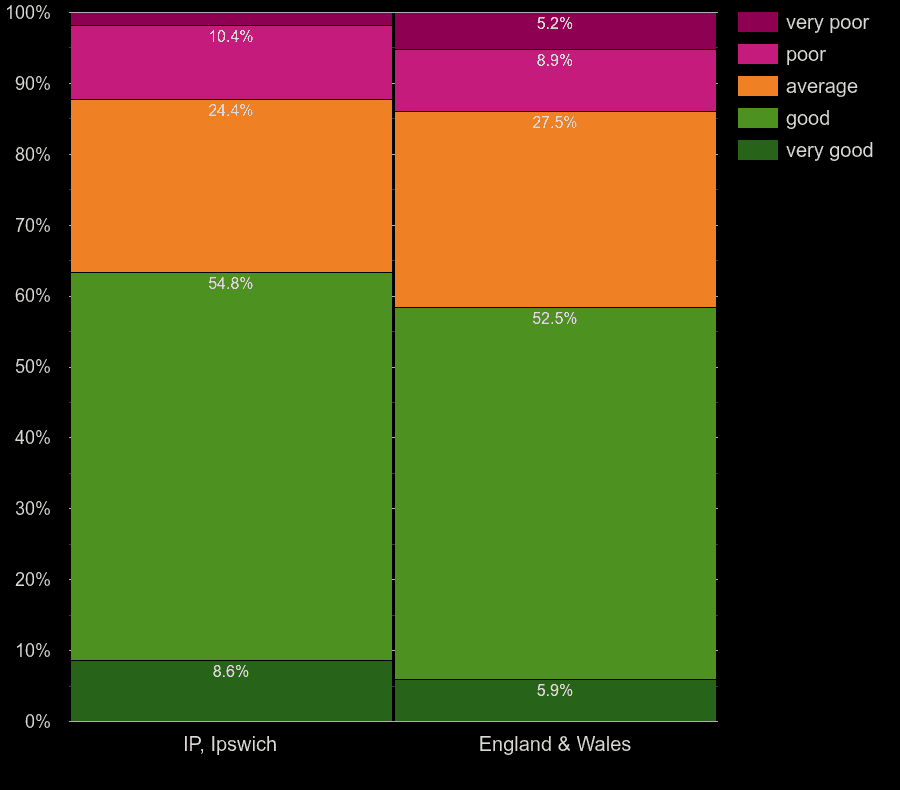
| Main heating control | Ipswich | England & Wales |
|---|
| █ very poor | 1.9% | 5.2% |
| █ poor | 10.4% | 8.9% |
| █ average | 24.4% | 27.5% |
| █ good | 54.8% | 52.5% |
| █ very good | 8.6% | 5.9% |
Ipswich homes by main heating energy efficiency
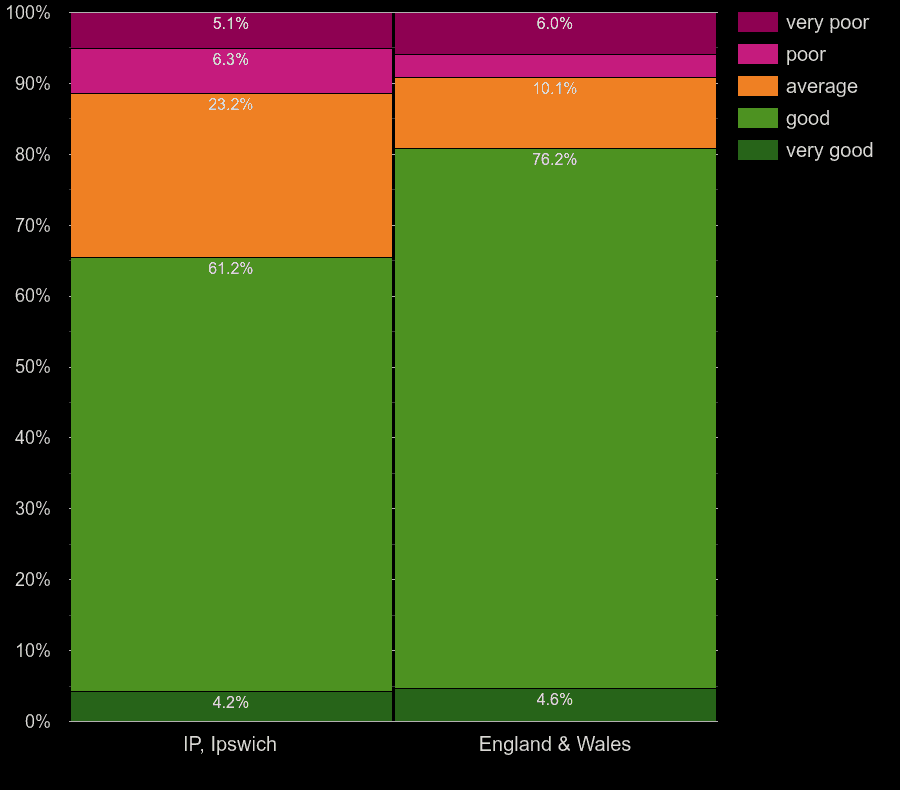
| Main heat efficiency | Ipswich | England & Wales |
|---|
| █ very poor | 5.1% | 6.0% |
| █ poor | 6.3% | 3.2% |
| █ average | 23.2% | 10.1% |
| █ good | 61.2% | 76.2% |
| █ very good | 4.2% | 4.6% |
Ipswich homes by walls energy efficiency
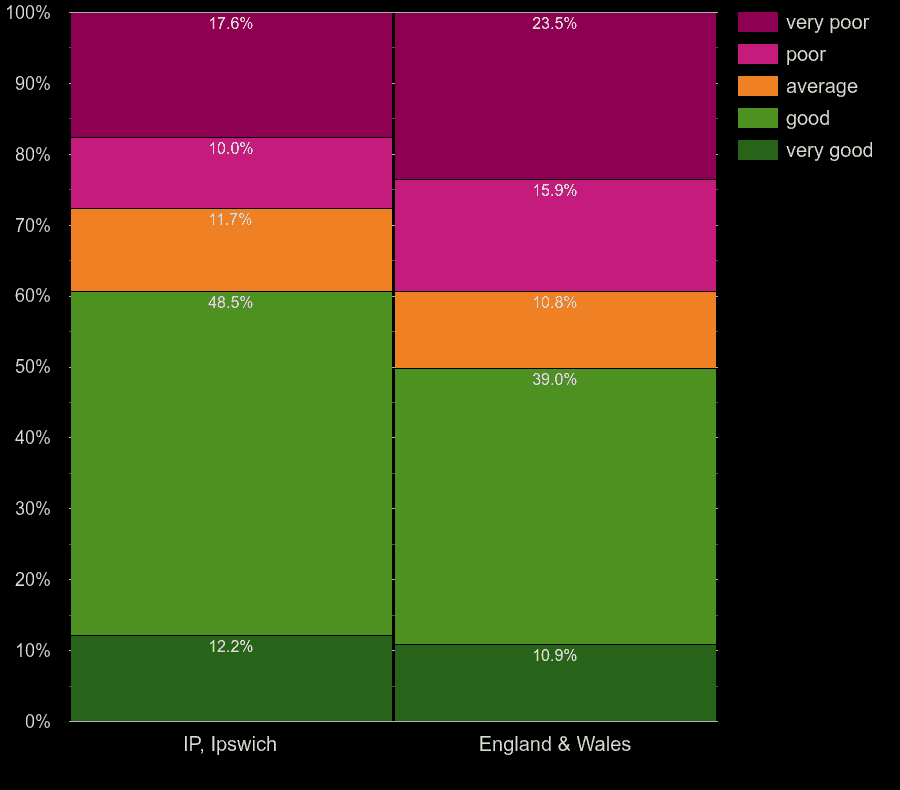
| Walls efficiency | Ipswich | England & Wales |
|---|
| █ very poor | 17.6% | 23.5% |
| █ poor | 10.0% | 15.9% |
| █ average | 11.7% | 10.8% |
| █ good | 48.5% | 39.0% |
| █ very good | 12.2% | 10.9% |
Ipswich homes by windows energy efficiency
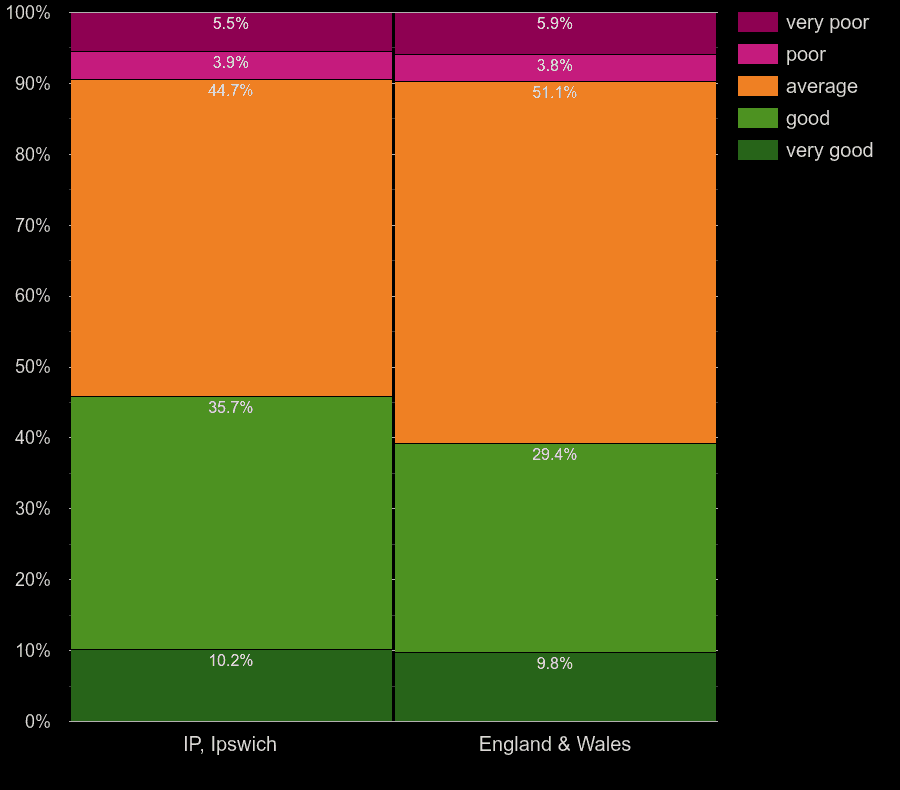
| Windows efficiency | Ipswich | England & Wales |
|---|
| █ very poor | 5.5% | 5.9% |
| █ poor | 3.9% | 3.8% |
| █ average | 44.7% | 51.1% |
| █ good | 35.7% | 29.4% |
| █ very good | 10.2% | 9.8% |
Ipswich homes by hot water heating energy efficiency
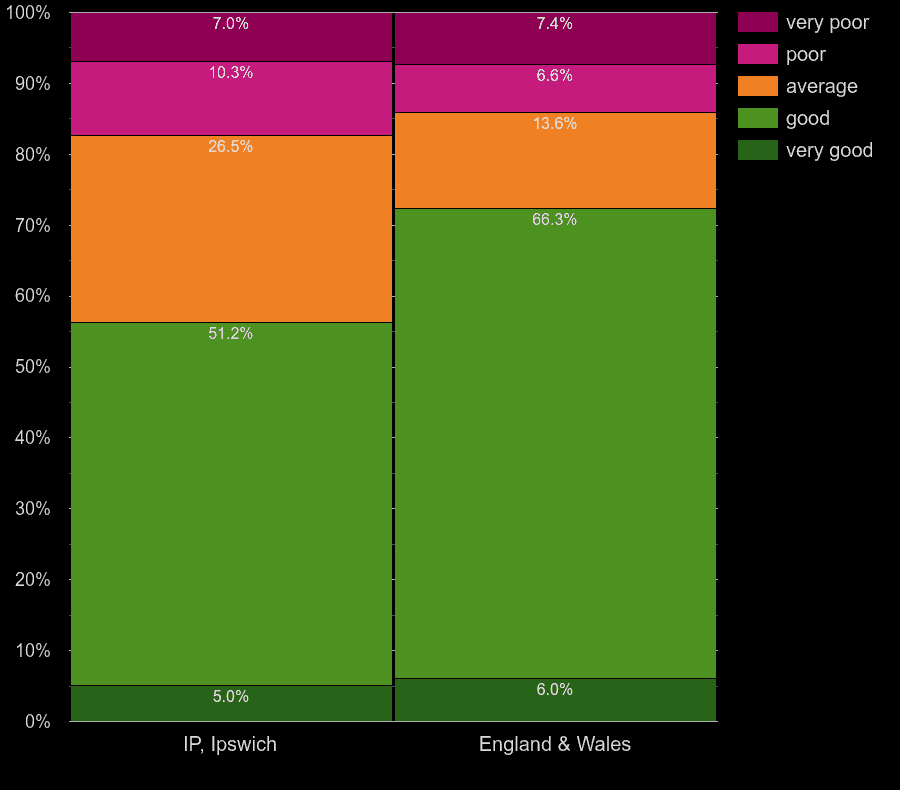
| Hot water heating energy efficiency | Ipswich | England & Wales |
|---|
| █ very poor | 7.0% | 7.4% |
| █ poor | 10.3% | 6.6% |
| █ average | 26.5% | 13.6% |
| █ good | 51.2% | 66.3% |
| █ very good | 5.0% | 6.0% |
Ipswich homes by lighting energy efficiency
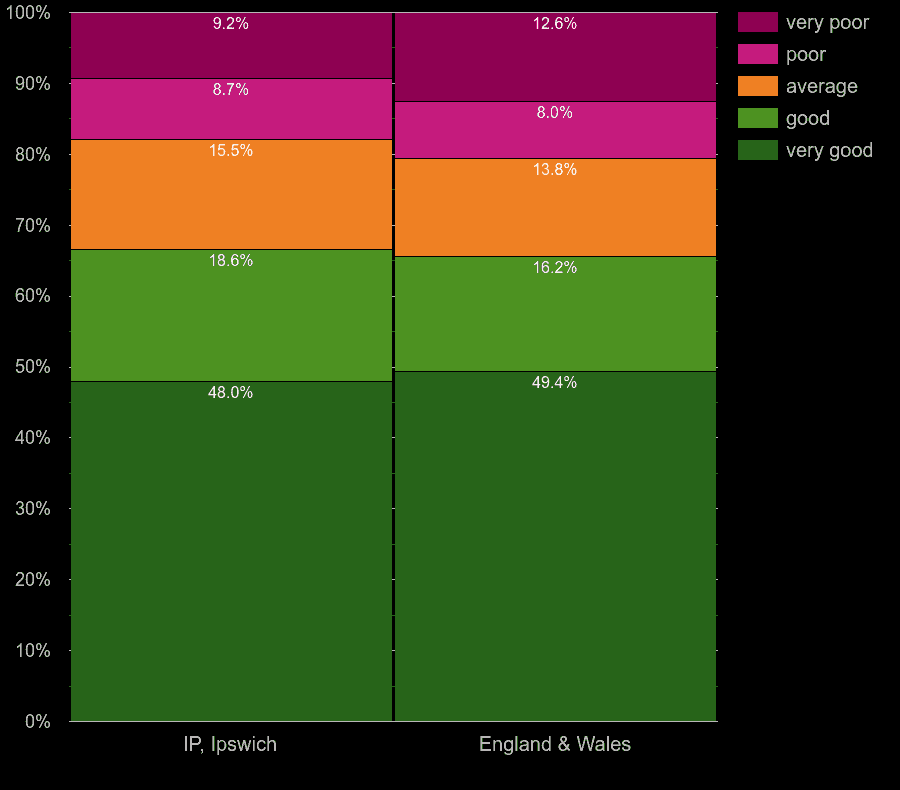
| Lightning energy efficiency | Ipswich | England & Wales |
|---|
| █ very poor | 9.2% | 12.6% |
| █ poor | 8.7% | 8.0% |
| █ average | 15.5% | 13.8% |
| █ good | 18.6% | 16.2% |
| █ very good | 48.0% | 49.4% |
Plumplot area insights - interactive charts and maps
Other reports for Ipswich postcode area


 login →