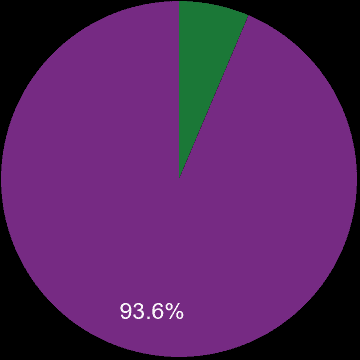
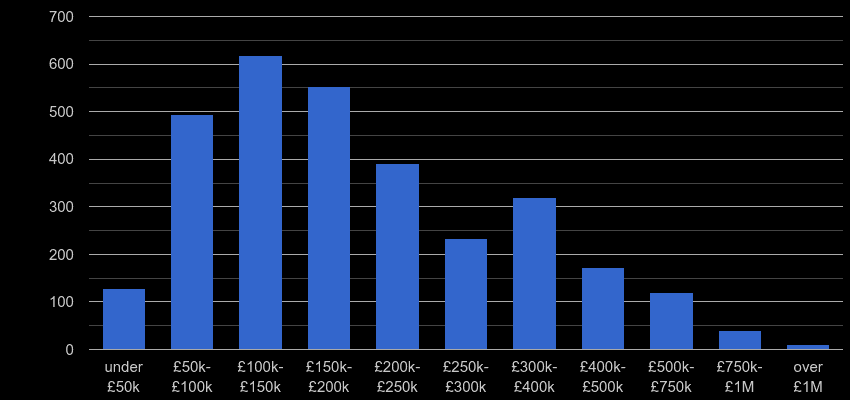
There were 3.8k property sales in Northumberland county in the previous twelve months and sales dropped by 20.9% (-1.1k transactions). 250 properties, 6.6% were sales of a newly built property. Most properties were sold in the £100k-£150k price range with 759 (20.0%) properties sold, followed by £150k-£200k price range with 694 (18.3%) properties sold.


| Property price range | Market share | Sales volume |
|---|---|---|
| under £50k | 4.1% | 156 |
| £50k-£100k | 13.2% | 498 |
| £100k-£150k | 20.0% | 759 |
| £150k-£200k | 18.3% | 694 |
| £200k-£250k | 12.4% | 471 |
| £250k-£300k | 9.5% | 358 |
| £300k-£400k | 11.4% | 430 |
| £400k-£500k | 5.4% | 203 |
| £500k-£750k | 4.9% | 185 |
| £750k-£1M | 0.6% | 22 |
| over £1M | 0.3% | 11 |
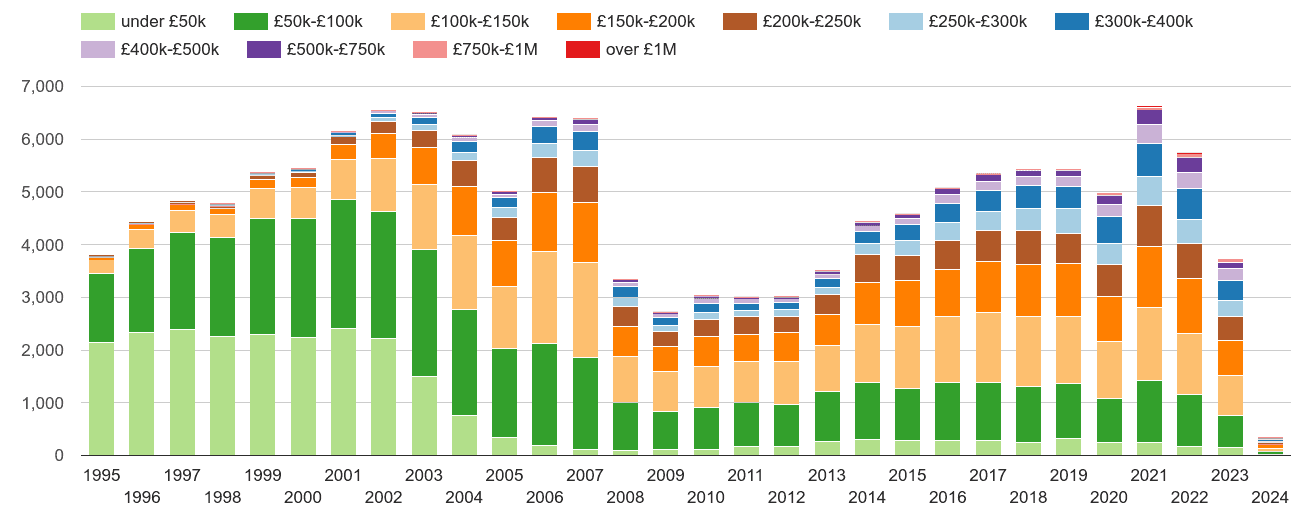
Yearly property sales volume by nominal price ranges

Total sales volume by year

Market share by year

Total sales volumes by year

Market share by year

shows the total volume of new properties sold a given postcode sector.