Buckinghamshire home energy efficiency
June 2023
Residential buildings are energetically very efficient. The average home energy rating in Buckinghamshire county is 67.4, D rating. This is by 2.4 better score than the average home energy rating in England and Wales. The average potential rating is 80.3, C rating.
Buckinghamshire homes by energy rating
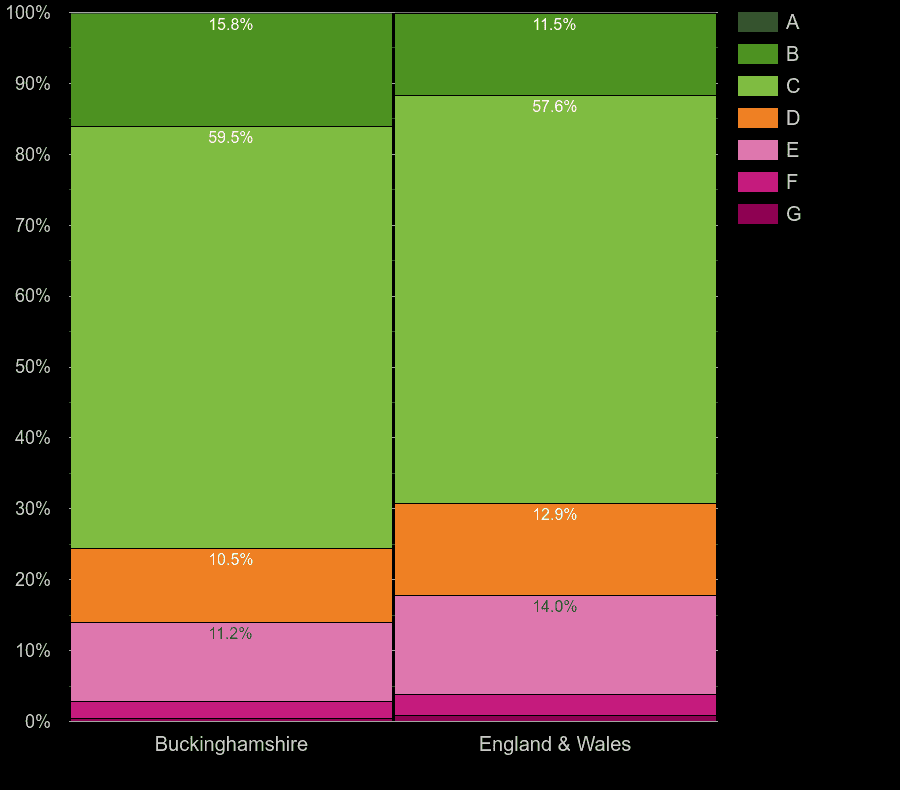
| Energy rating | Buckinghamshire | England & Wales |
|---|
| █ A | 0.2% | 0.1% |
| █ B | 15.8% | 11.5% |
| █ C | 59.5% | 57.6% |
| █ D | 10.5% | 12.9% |
| █ E | 11.2% | 14.0% |
| █ F | 2.3% | 3.0% |
| █ G | 0.5% | 0.8% |
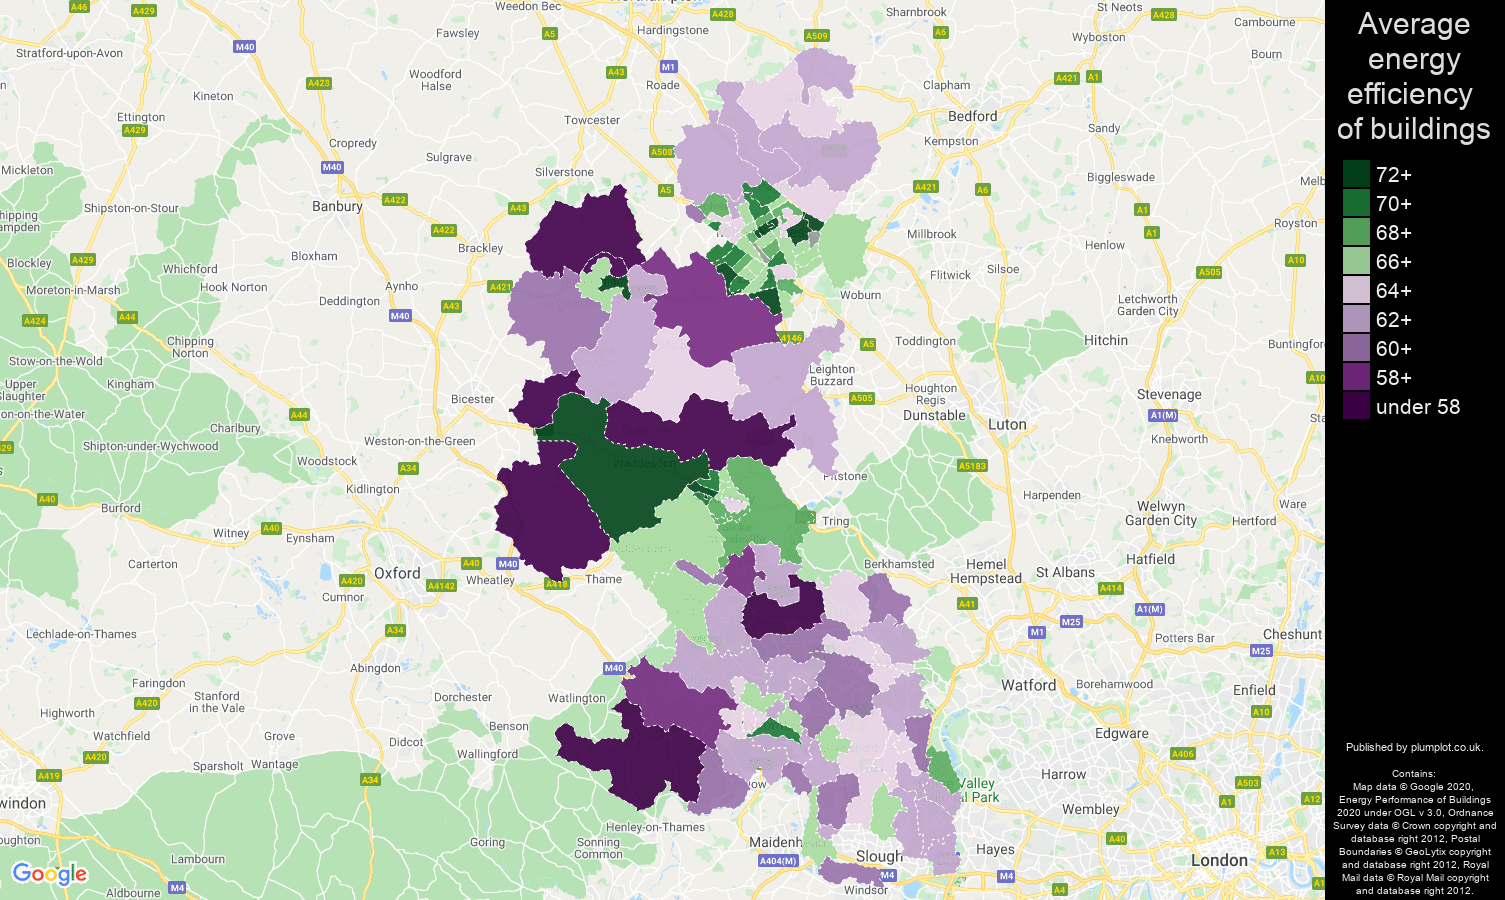
Buckinghamshire map of energy efficiency of properties
Buckinghamshire homes by potential energy rating
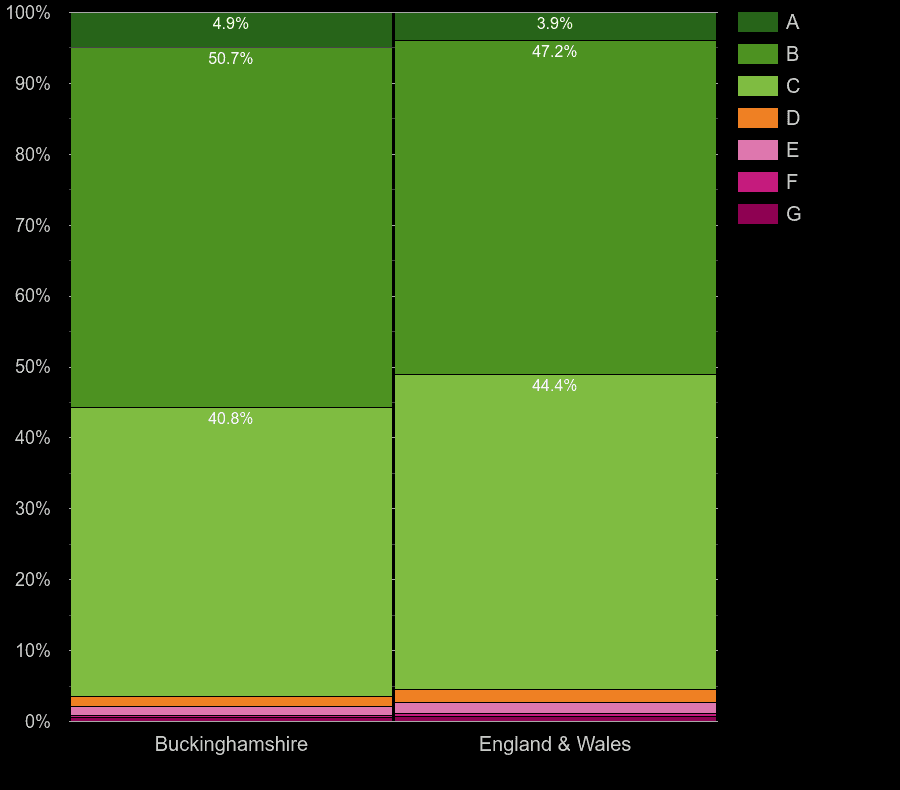
| Potential energy rating | Buckinghamshire | England & Wales |
|---|
| █ A | 4.9% | 3.9% |
| █ B | 50.7% | 47.2% |
| █ C | 40.8% | 44.4% |
| █ D | 1.4% | 1.8% |
| █ E | 1.3% | 1.6% |
| █ F | 0.3% | 0.4% |
| █ G | 0.5% | 0.7% |
Buckinghamshire homes by main heating control energy efficiency
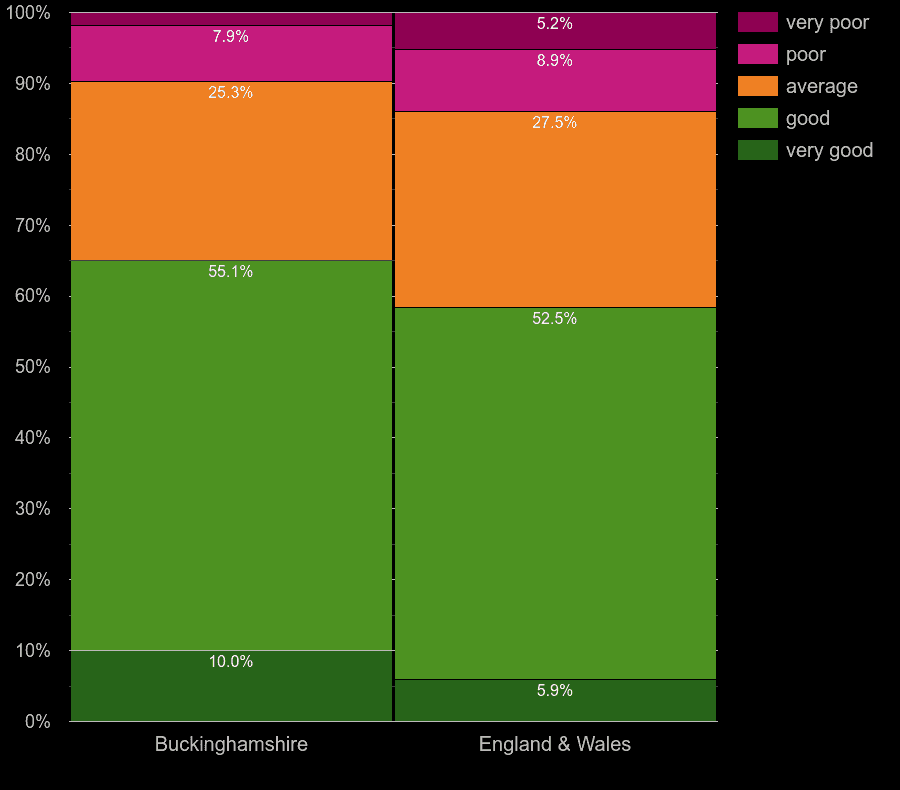
| Main heating control | Buckinghamshire | England & Wales |
|---|
| █ very poor | 1.8% | 5.2% |
| █ poor | 7.9% | 8.9% |
| █ average | 25.3% | 27.5% |
| █ good | 55.1% | 52.5% |
| █ very good | 10.0% | 5.9% |
Buckinghamshire homes by main heating energy efficiency
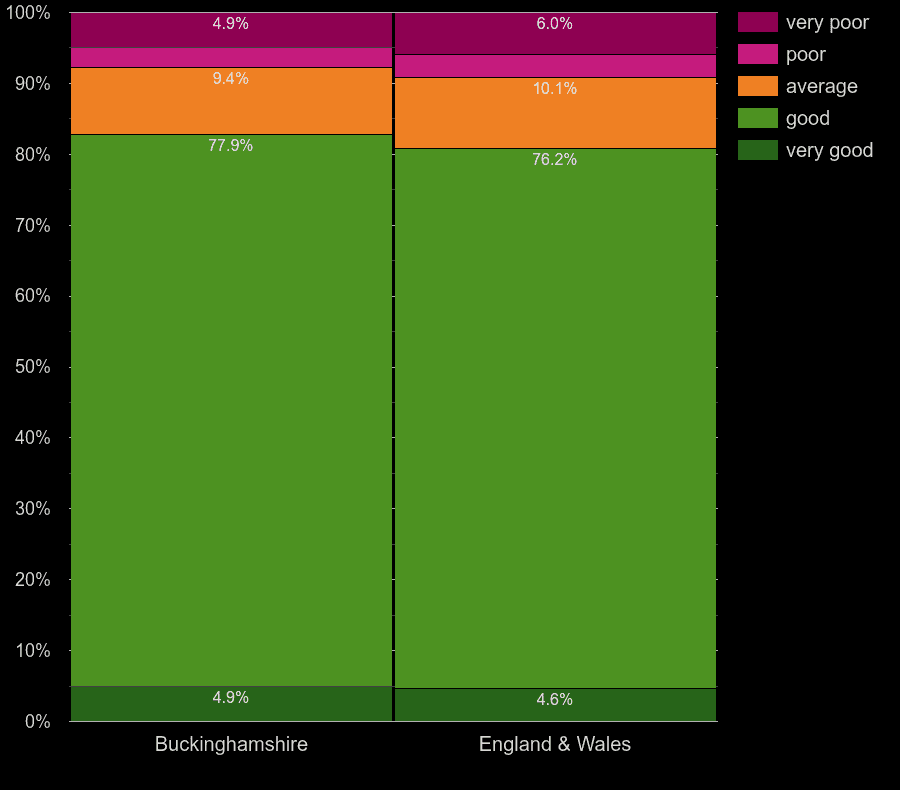
| Main heat efficiency | Buckinghamshire | England & Wales |
|---|
| █ very poor | 4.9% | 6.0% |
| █ poor | 2.9% | 3.2% |
| █ average | 9.4% | 10.1% |
| █ good | 77.9% | 76.2% |
| █ very good | 4.9% | 4.6% |
Buckinghamshire homes by walls energy efficiency
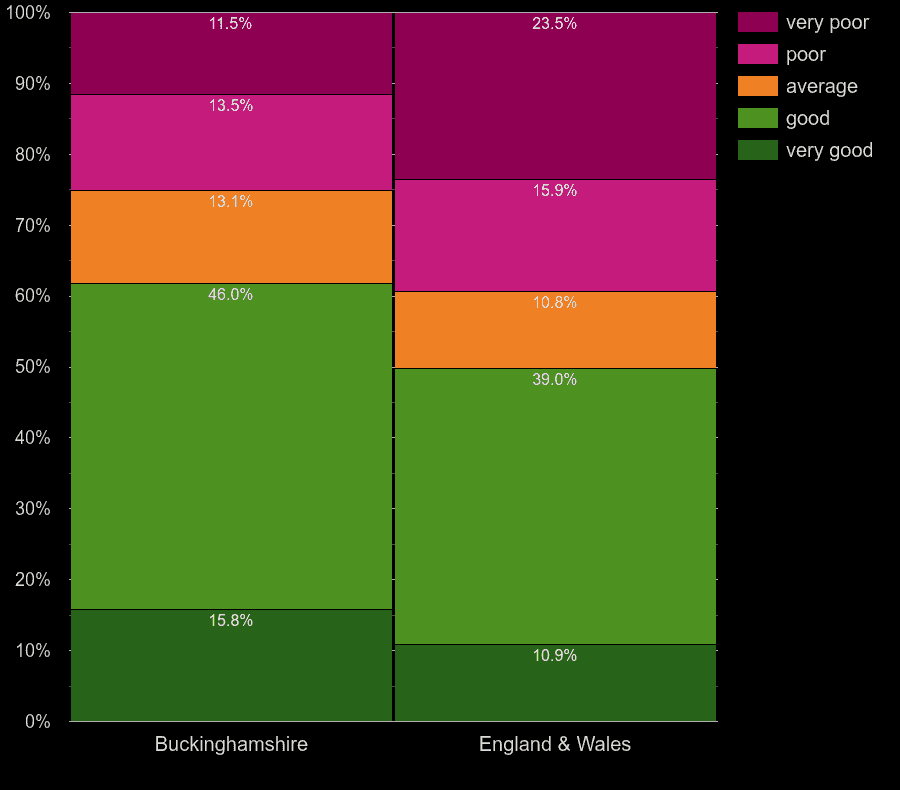
| Walls efficiency | Buckinghamshire | England & Wales |
|---|
| █ very poor | 11.5% | 23.5% |
| █ poor | 13.5% | 15.9% |
| █ average | 13.1% | 10.8% |
| █ good | 46.0% | 39.0% |
| █ very good | 15.8% | 10.9% |
Buckinghamshire homes by windows energy efficiency
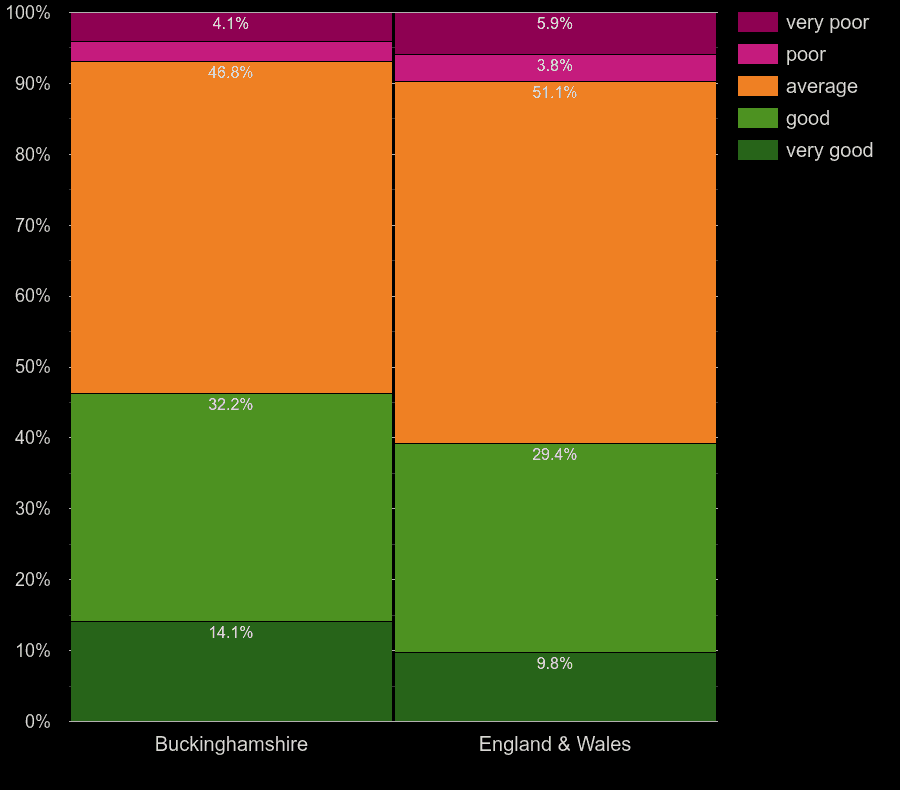
| Windows efficiency | Buckinghamshire | England & Wales |
|---|
| █ very poor | 4.1% | 5.9% |
| █ poor | 2.8% | 3.8% |
| █ average | 46.8% | 51.1% |
| █ good | 32.2% | 29.4% |
| █ very good | 14.1% | 9.8% |
Buckinghamshire homes by hot water heating energy efficiency
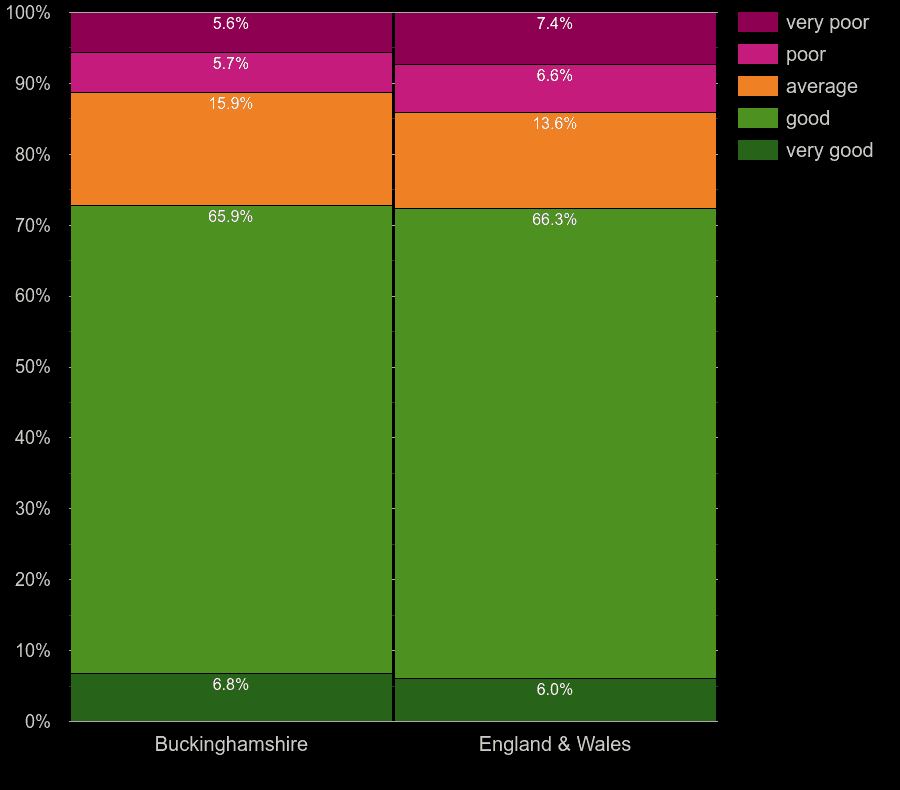
| Hot water heating energy efficiency | Buckinghamshire | England & Wales |
|---|
| █ very poor | 5.6% | 7.4% |
| █ poor | 5.7% | 6.6% |
| █ average | 15.9% | 13.6% |
| █ good | 65.9% | 66.3% |
| █ very good | 6.8% | 6.0% |
Buckinghamshire homes by lighting energy efficiency
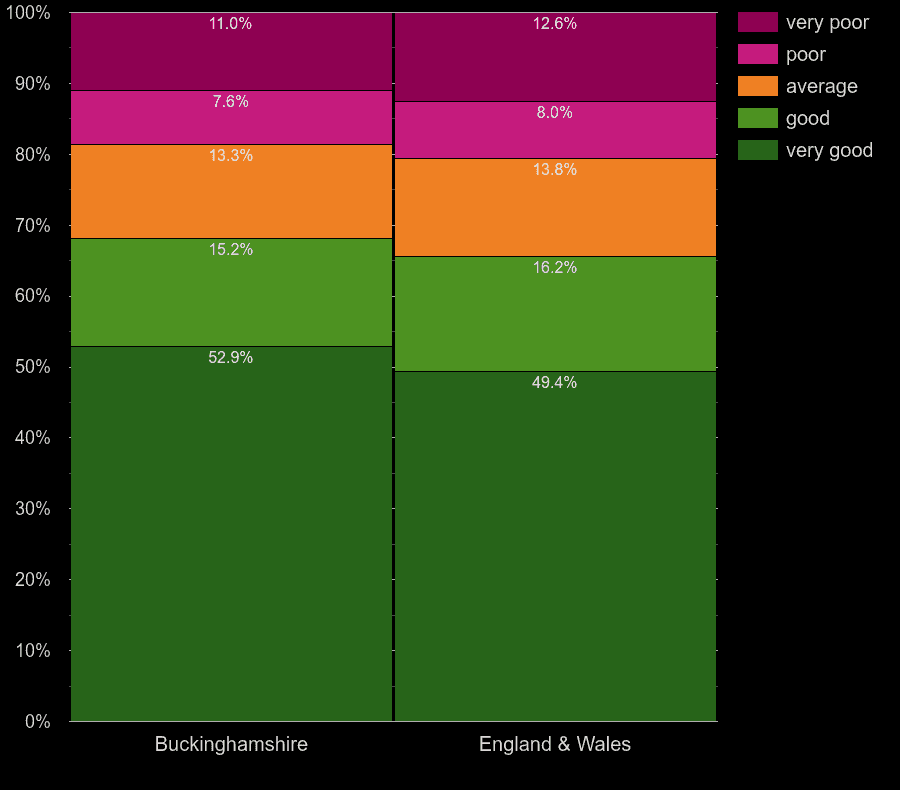
| Lightning energy efficiency | Buckinghamshire | England & Wales |
|---|
| █ very poor | 11.0% | 12.6% |
| █ poor | 7.6% | 8.0% |
| █ average | 13.3% | 13.8% |
| █ good | 15.2% | 16.2% |
| █ very good | 52.9% | 49.4% |
Plumplot area insights - interactive charts and maps
Other reports for Buckinghamshire county


