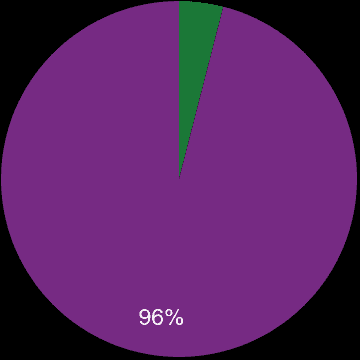
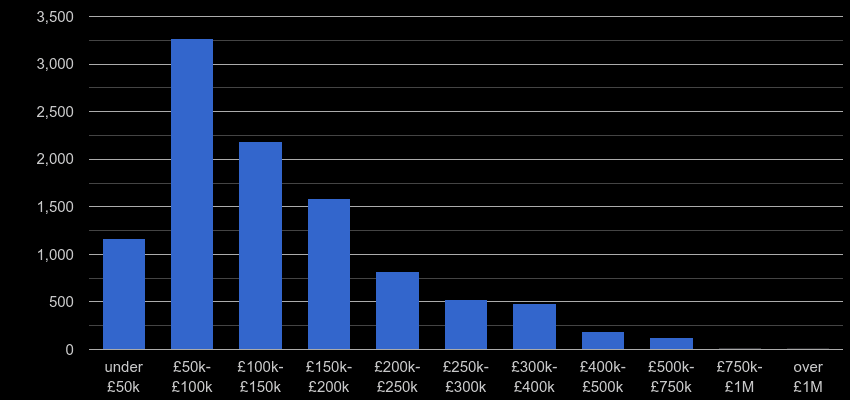
There were 12.7k property sales in Durham county county in the previous twelve months and sales dropped by 12.5% (-2.0k transactions). 720 properties, 5.7% were sales of a newly built property. Most properties were sold in the £50k-£100k price range with 3186 (25.0%) properties sold, followed by £100k-£150k price range with 2804 (22.0%) properties sold.

| New or established | Percentage share | Sales volume |
|---|---|---|
| █ A newly built property | 5.7% | 720 |
| █ An established property | 94.3% | 12.0k |
| All properties | 100% | 12.7k |

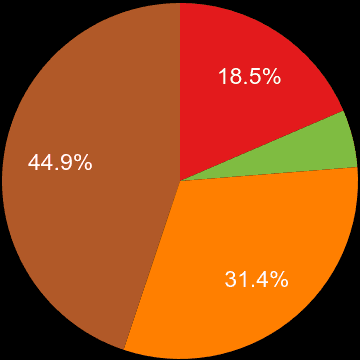
| House Type | Percentage share | Sales volume |
|---|---|---|
| █ Detached | 24.2% | 3.1k |
| █ Flat | 4.0% | 513 |
| █ Semi-Detached | 31.6% | 4.0k |
| █ Terraced | 40.2% | 5.1k |

| Property price range | Market share | Sales volume |
|---|---|---|
| under £50k | 7.9% | 1.0k |
| £50k-£100k | 25.0% | 3.2k |
| £100k-£150k | 22.0% | 2.8k |
| £150k-£200k | 17.9% | 2.3k |
| £200k-£250k | 10.0% | 1.3k |
| £250k-£300k | 6.8% | 865 |
| £300k-£400k | 6.3% | 807 |
| £400k-£500k | 2.2% | 280 |
| £500k-£750k | 1.5% | 194 |
| £750k-£1M | 0.2% | 22 |
| over £1M | 0.1% | 7 |
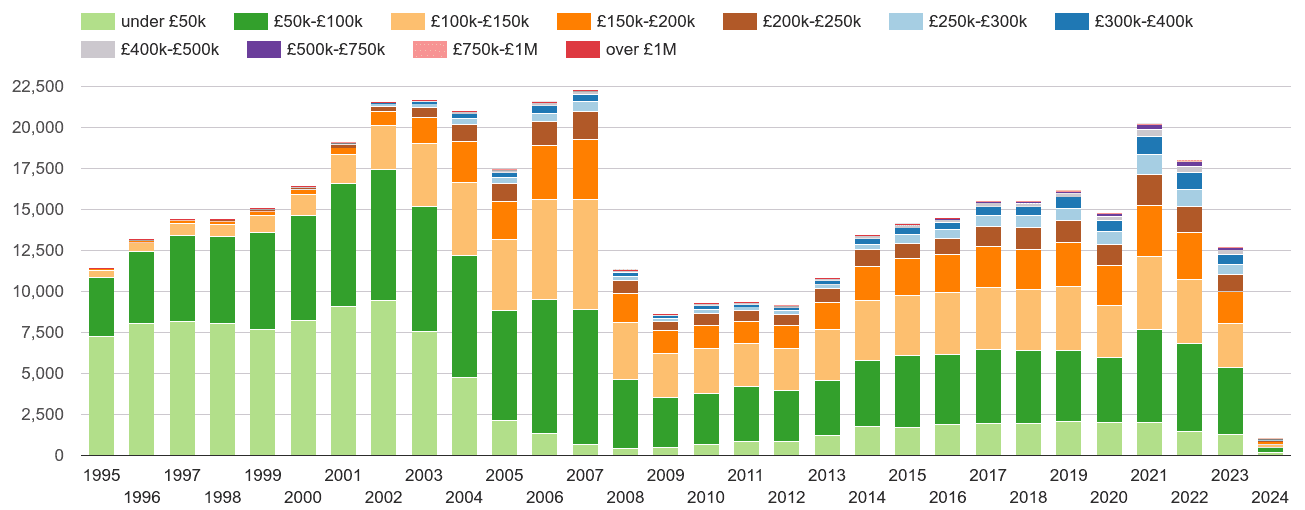
Yearly property sales volume by nominal price ranges

Total sales volume by year

Market share by year

Total sales volumes by year

Market share by year

shows the total volume of new properties sold a given postcode sector.