| Population Estimates | Value in 2024 |
|---|---|
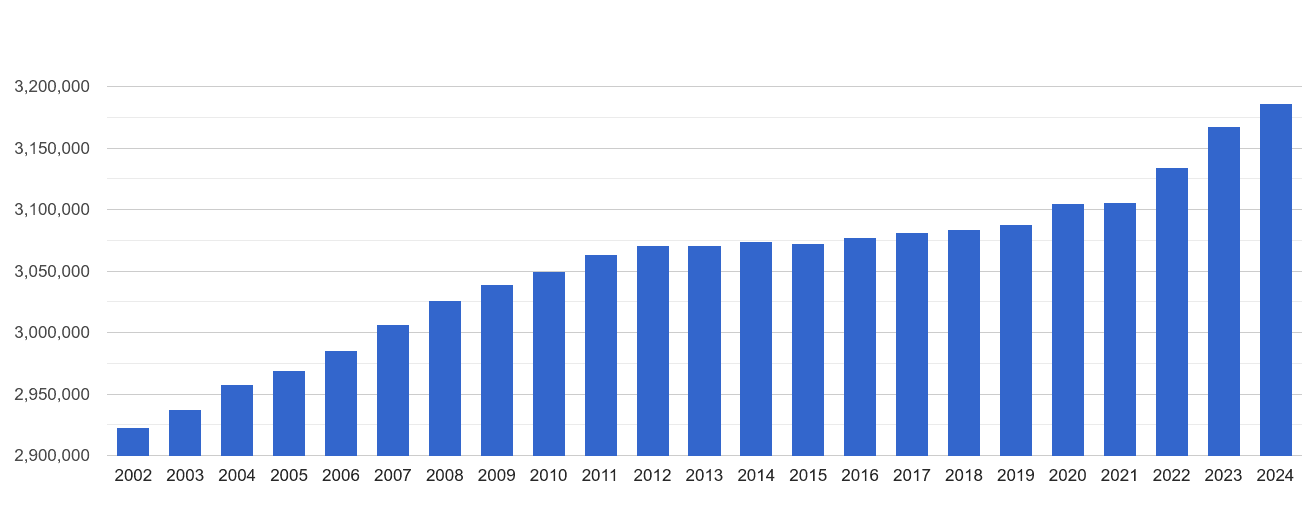
| Total residents | 3.2M |
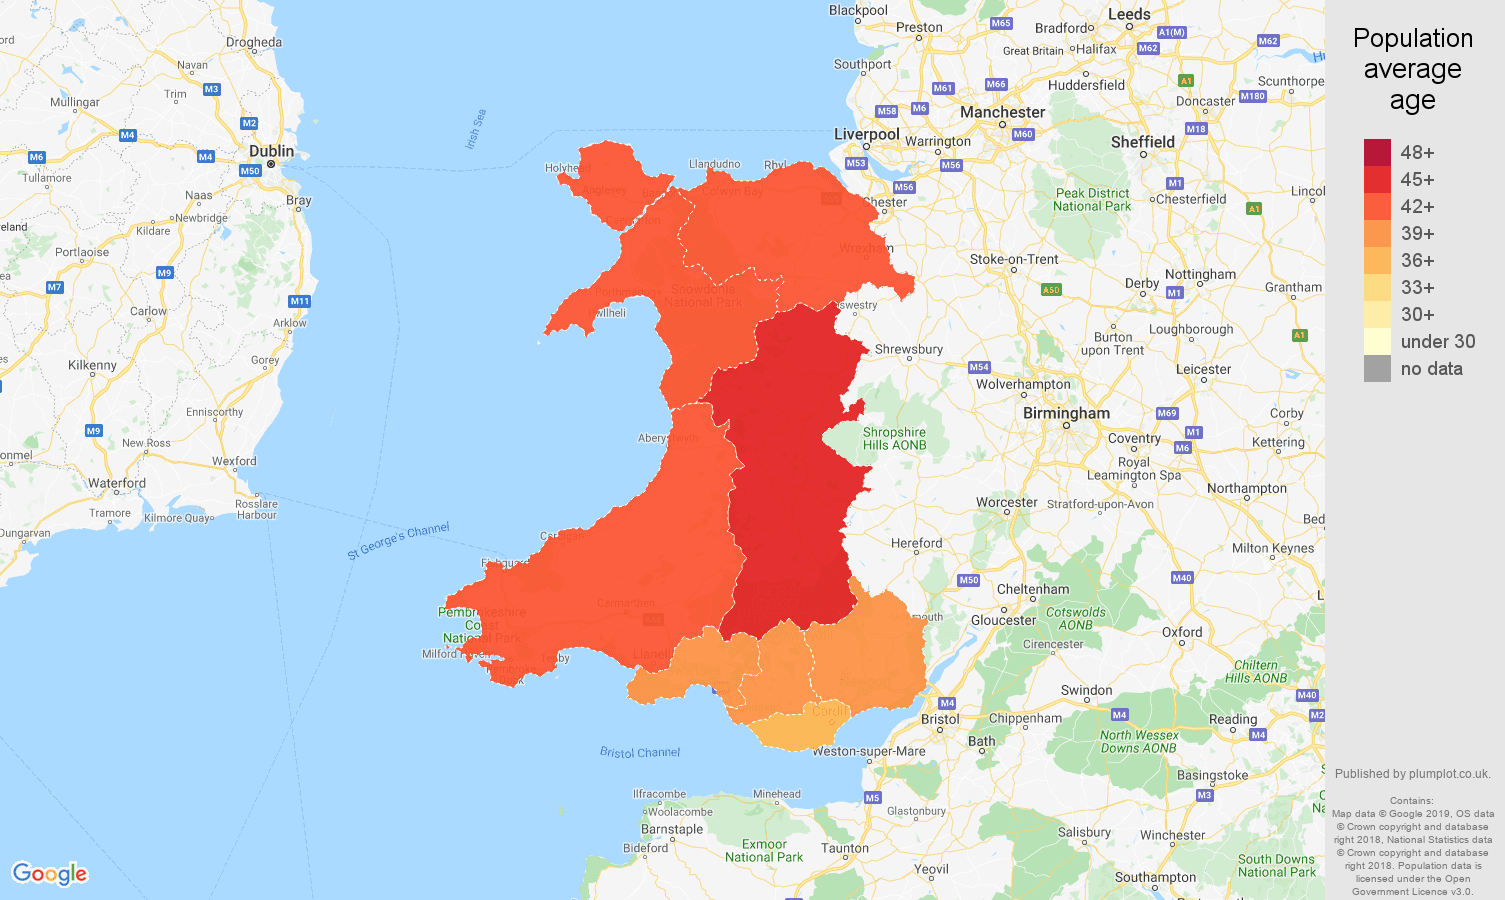
| Average age | 42.5 |
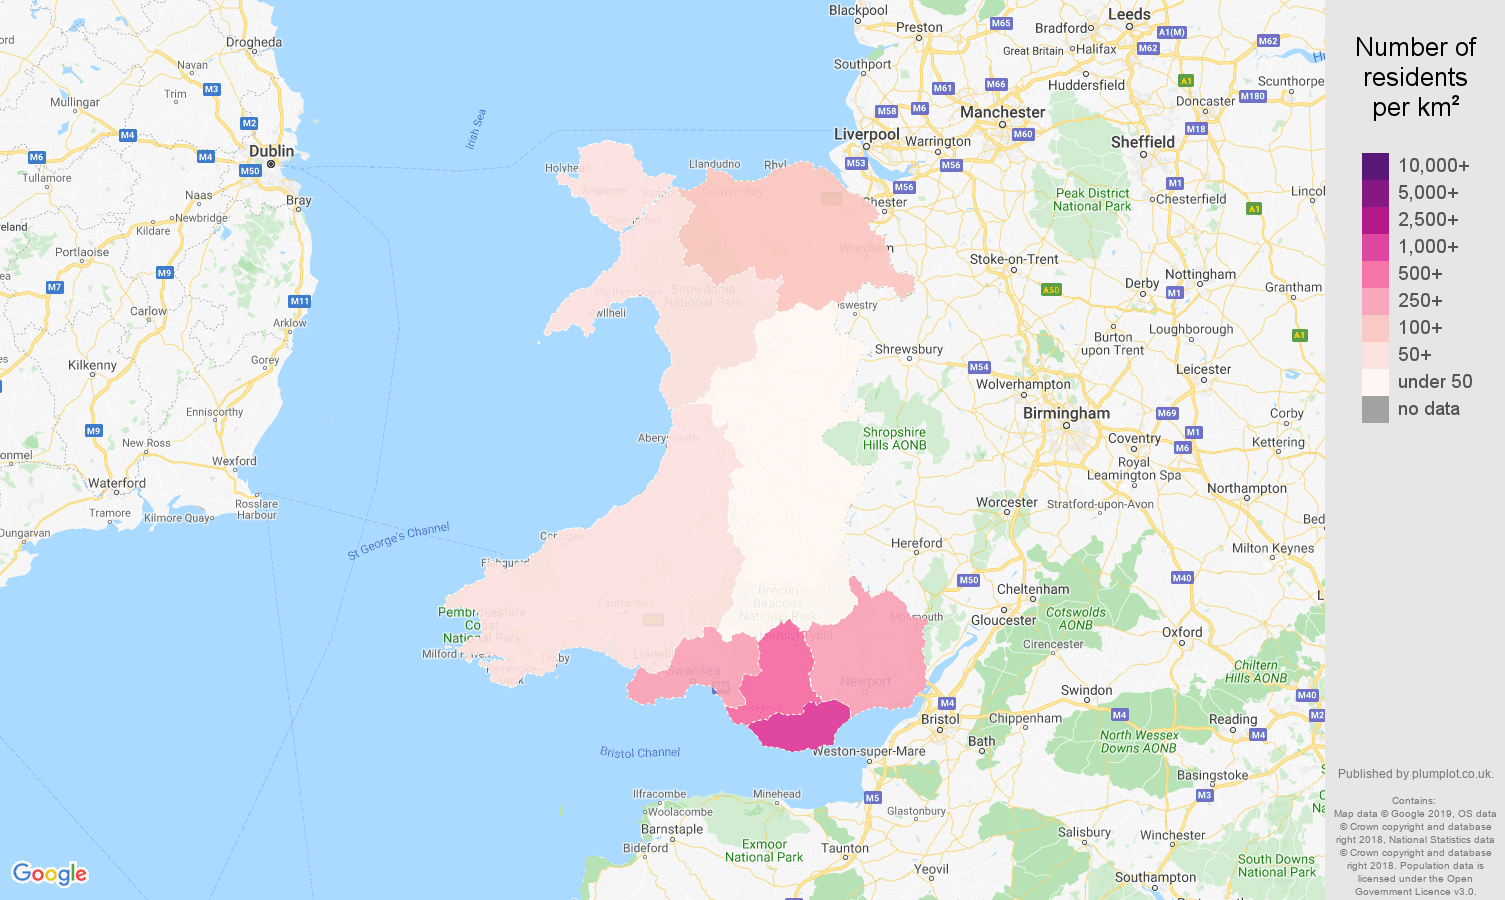
| Population density | 153 |
shows a number of residents per square kilometer(km2), estimates from 2020.
Population average age by LSOA (County) in 2018.
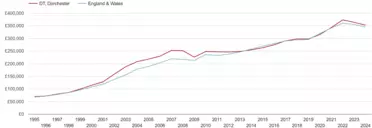
Total population per year outlines headcount differences.
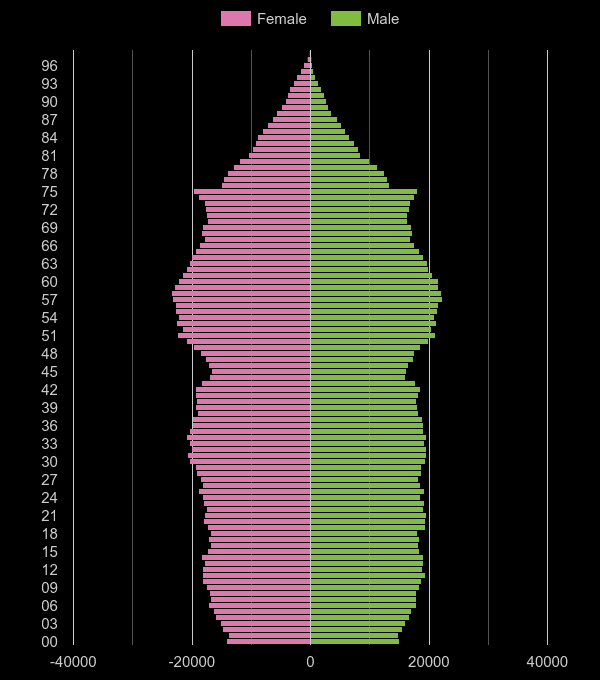
shows the distribution of various age groups in a population in 2024. Females are shown on the left, males are shown on the right.
Shares of population age groups compared to corresponding shares of population groups in England & Wales, 2024.
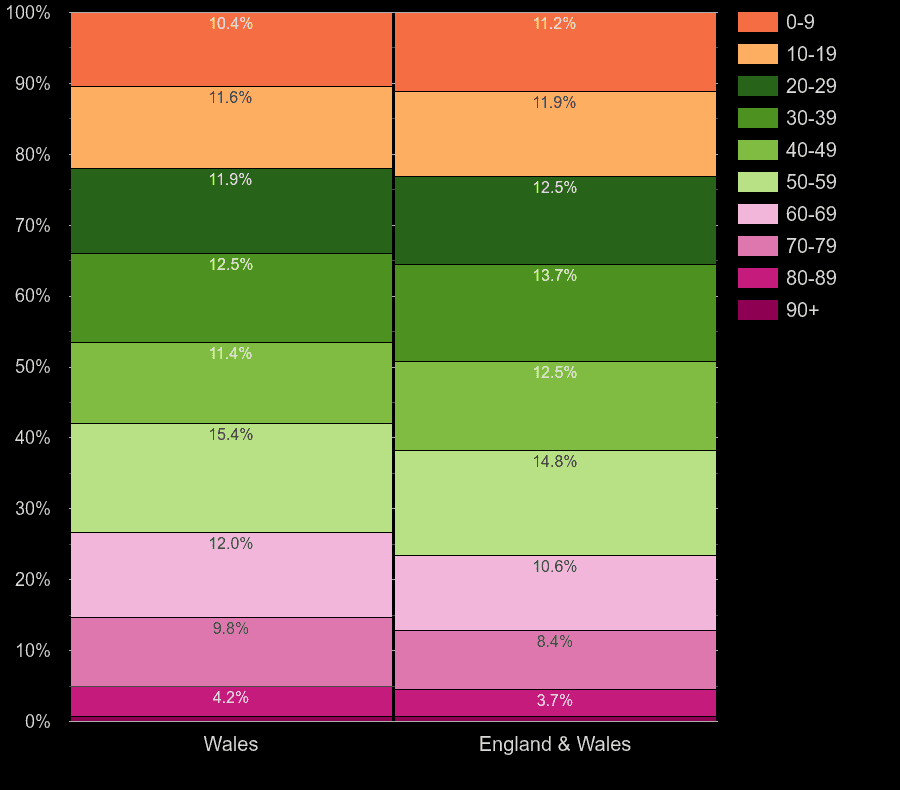
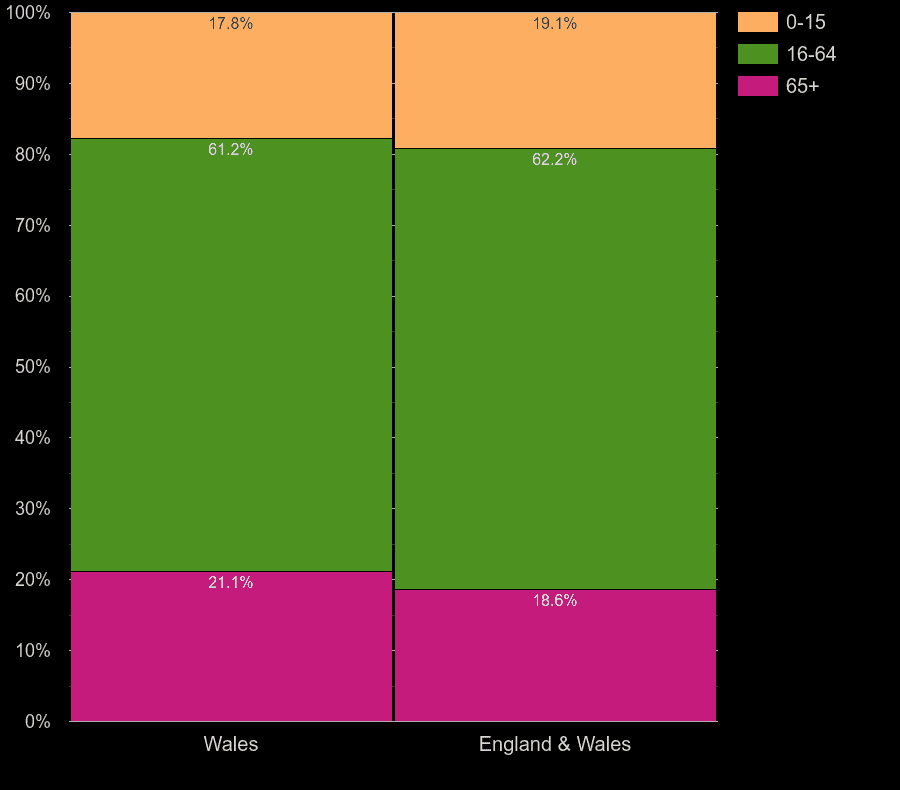
| age group | head-count | % share of population | % for Eng & Wales |
|---|---|---|---|
| 0-15 | 546k | 17.1% | 18.3% |
| 16-64 | 1.9M | 61.1% | 62.8% |
| 65+ | 693k | 21.7% | 18.9% |
Comparison of regions average ages, 2024 population estimates.
![]()
| region | Average age in 2024 |
|---|---|
| Wales | 42.5 |
| England & Wales | 40.8 |
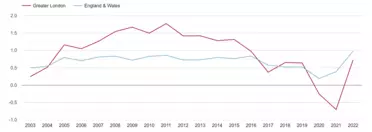
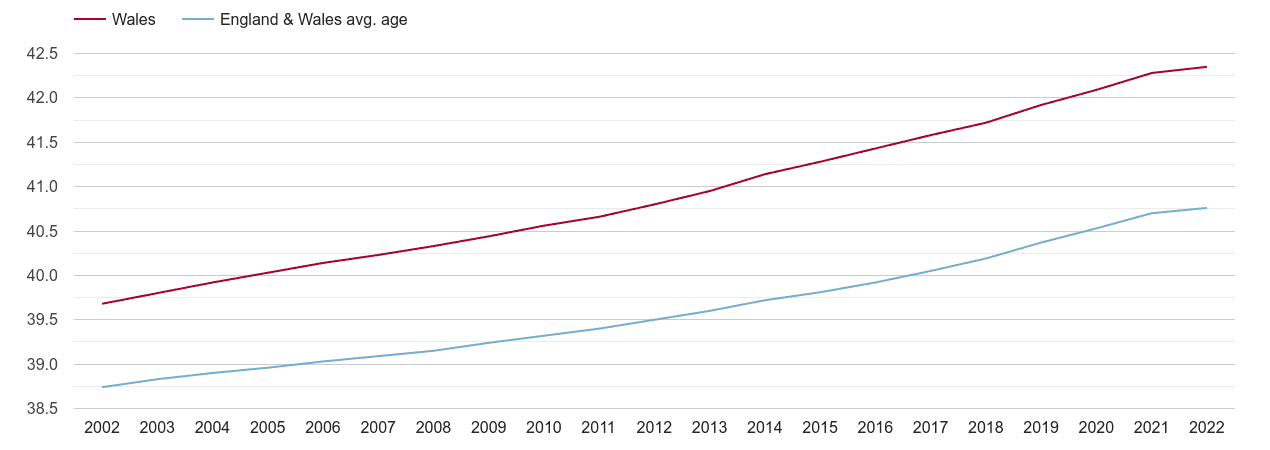
Annual area statistics of Wales's population average age compared to country statistics.
 login →