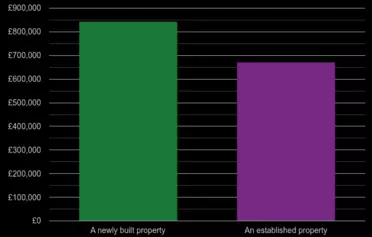
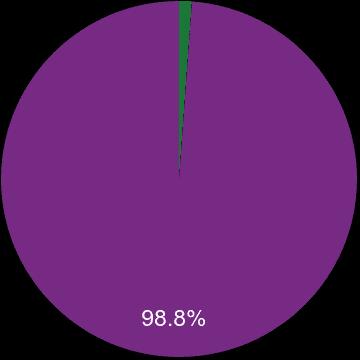
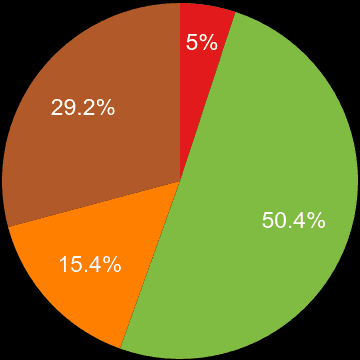
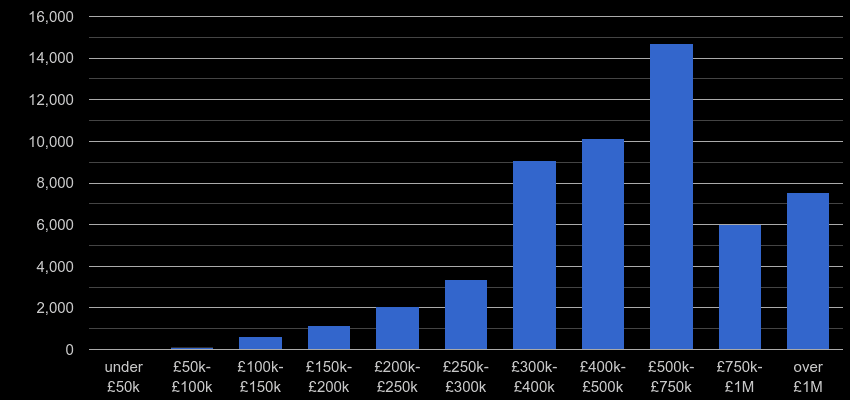
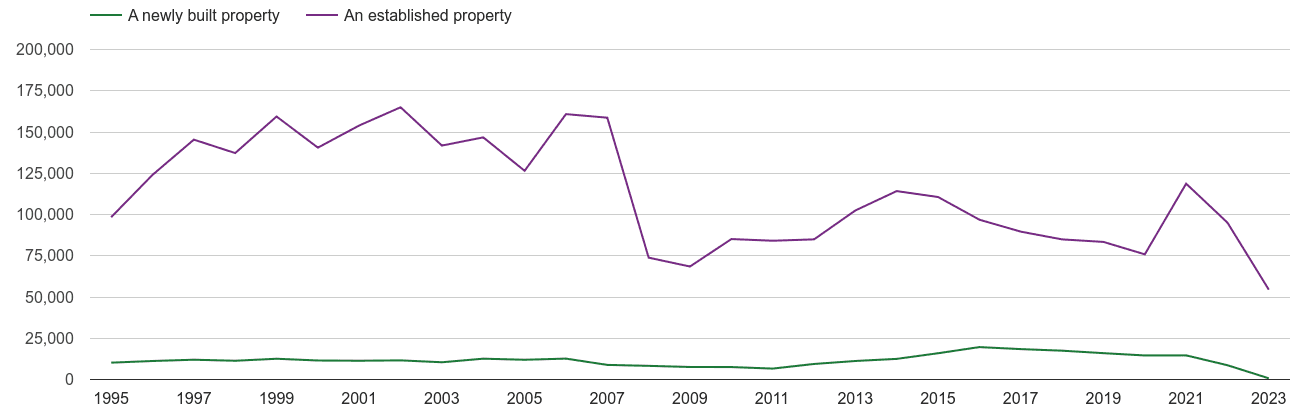
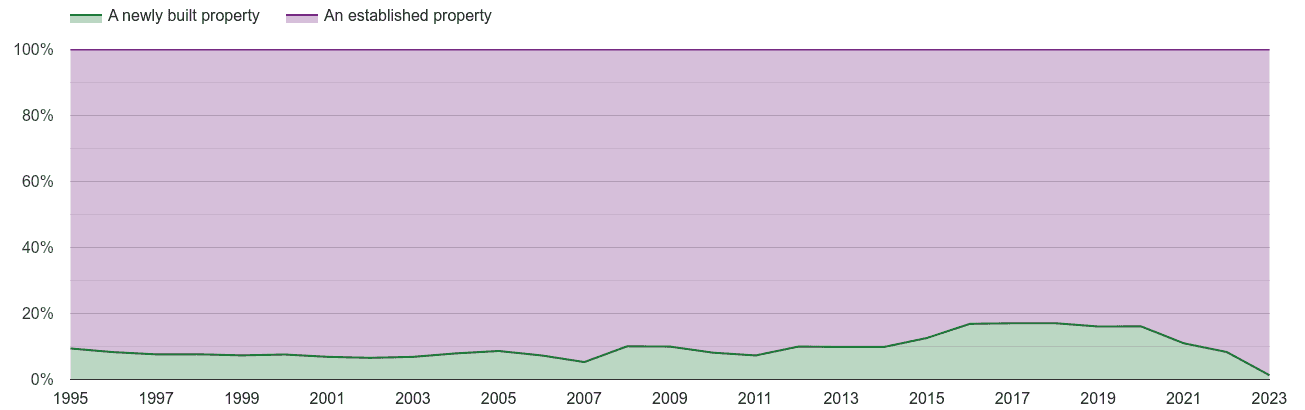
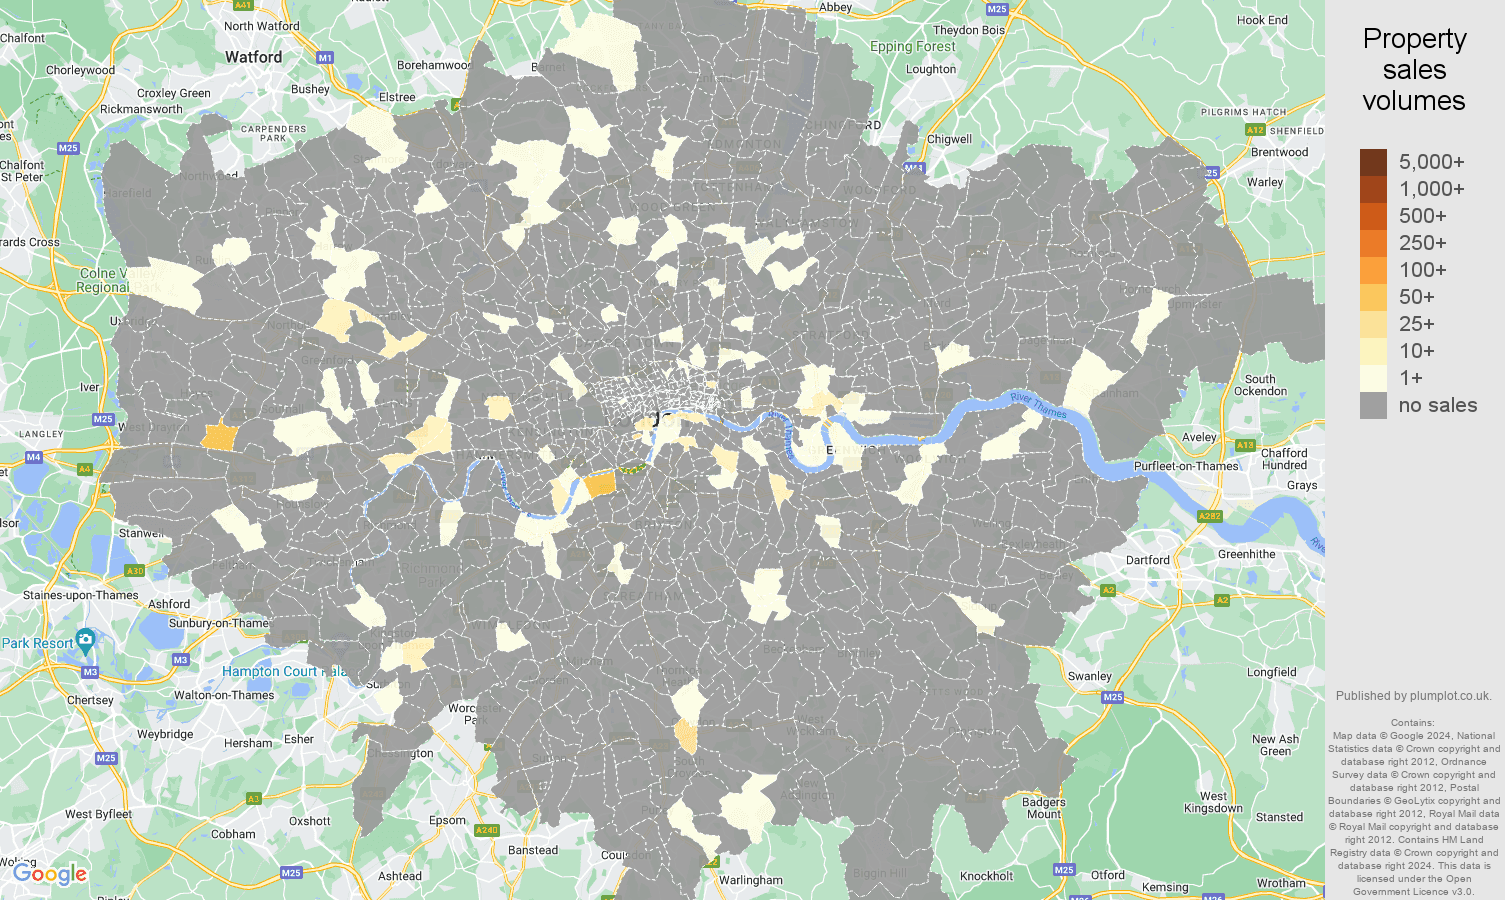
There were 69.4k property sales in London region in the previous twelve months and sales dropped by 15.0% (-13.0k transactions). 1.8k properties, 2.5% were sales of a newly built property. Most properties were sold in the £500k-£750k price range with 19541 (28.2%) properties sold, followed by £400k-£500k price range with 13720 (19.8%) properties sold.
| Property price range | Market share | Sales volume |
|---|---|---|
| under £50k | 0.0% | 1 |
| £50k-£100k | 0.2% | 152 |
| £100k-£150k | 1.0% | 717 |
| £150k-£200k | 1.9% | 1.3k |
| £200k-£250k | 3.6% | 2.5k |
| £250k-£300k | 5.6% | 3.9k |
| £300k-£400k | 16.7% | 11.6k |
| £400k-£500k | 19.8% | 13.7k |
| £500k-£750k | 28.2% | 19.5k |
| £750k-£1M | 11.3% | 7.8k |
| over £1M | 11.8% | 8.2k |
Yearly property sales volume by nominal price ranges
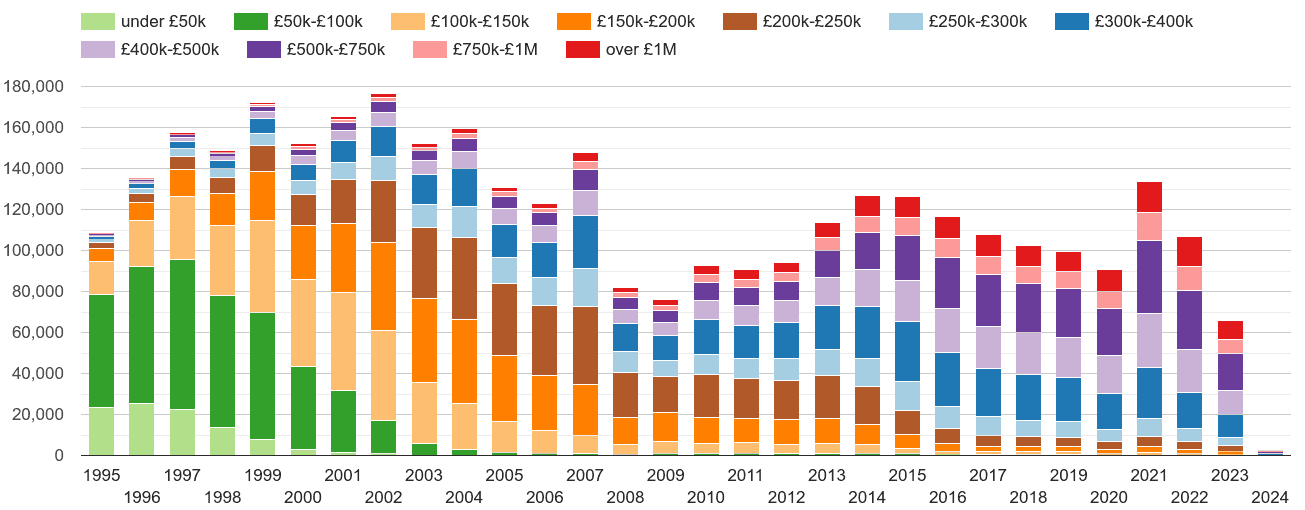
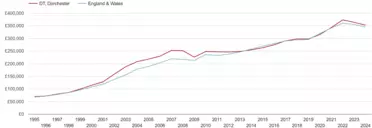
Total sales volume by year
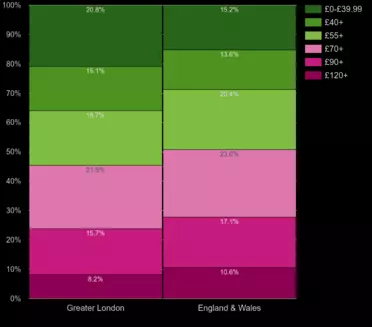
Market share by year
Total sales volumes by year
Market share by year
shows the total volume of new properties sold a given postcode sector.
| Postcode sector | Sales volume | Market share | |
|---|---|---|---|
 login →